
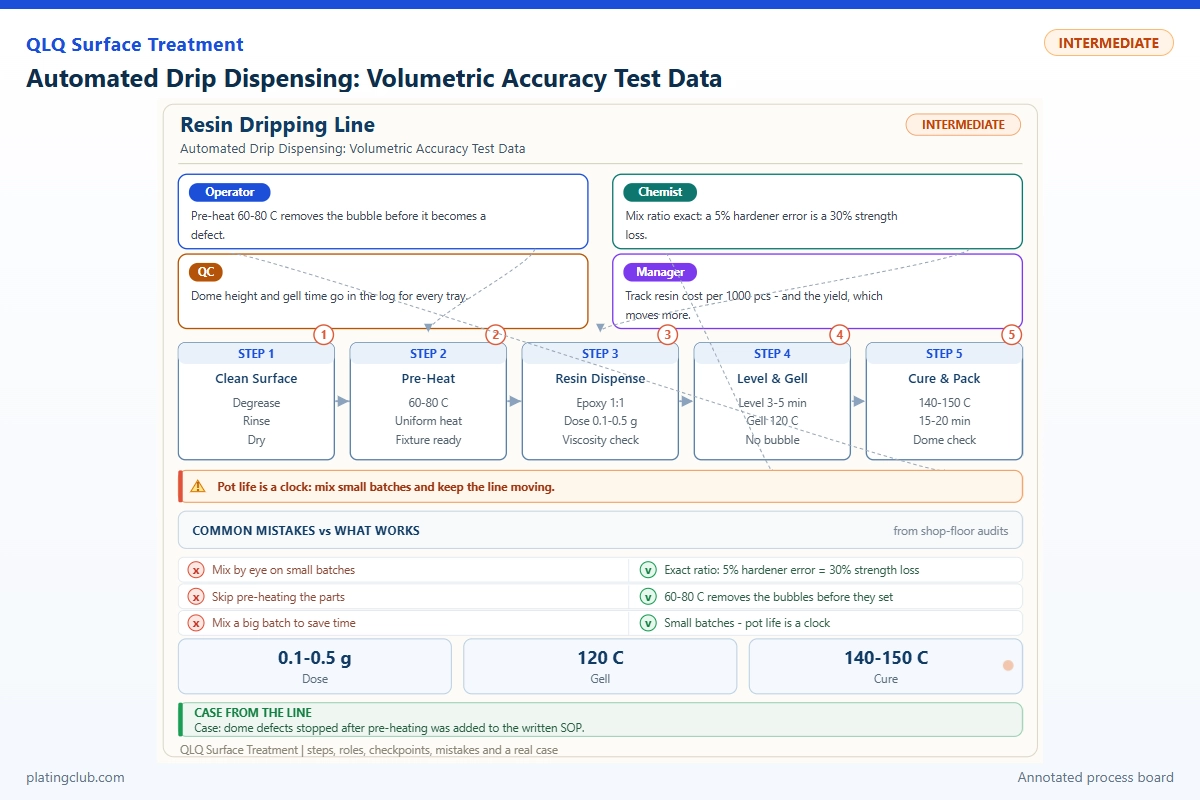
Resin Dripping | Management-Level Process Control
Automated Drip Dispensing: Volumetric Accuracy Test Data
Automated resin dripping on plated zinc-alloy bag hardware requires three separate approvals: correct quantity, correct component ratio, and acceptable cured performance. A dispenser can repeat the wrong shot perfectly. Management must therefore connect gravimetric verification, material traceability, substrate preparation, and release authority instead of accepting a machine repeatability claim as proof of finished-part quality.
Evidence status: No authenticated QLQ resin-dripping batch measurements, corrosion reports, or customer case results were available for this article. The numerical shot dataset below is explicitly synthetic training data, not an experiment performed by QLQ. Material reference values are attributed to a manufacturer. Control limits are proposed commissioning limits requiring plant validation; unmeasured performance remains marked “not tested.”
1. Define the measurement before approving the machine
Specify volume at the nozzle, not reservoir depletion. Reservoir loss includes purging, leakage, and waste. For a recessed decorative feature, distinguish wet deposited volume from cured dome height: recess area, meniscus shape, cure shrinkage, and surface wetting all influence the final profile. Record plated finish, cleaning method, recess dimensions, fixture position, and acceptable overflow before calculating shot size.
Use mass as the primary shop-floor measurement, then convert using the mixed resin density at the actual dispensing temperature. Obtain density from a current supplier certificate or a validated measurement; do not substitute water density. For two-component equipment, verify each component separately as well as the mixed outlet. Total mass cannot detect one pump delivering too much resin while the other delivers too little hardener.
Volume V = net mass m / mixed density rho
Bias (%) = 100 × (mean V − target V) / target V
CV (%) = 100 × sample standard deviation / mean V
Mass ratio A:B = (rhoA × VA):(rhoB × VB)
For the worked calculation only, assume a target of 0.500 mL and a measured mixed density of 1.100 g/mL. The target mass is 0.5500 g. A 0.0001 g balance resolution corresponds to 0.000091 mL; resolution is not the same as accuracy. Check calibration, drafts, tare stability, cup handling, and density uncertainty before declaring a 1% process capability.
2. Complete working formulation: a supplied two-part kit
A complete application formulation can be a matched resin-and-hardener kit; it need not disclose a supplier’s proprietary raw-material recipe. Fong Yong publishes a 3:1 mass ratio for E-1158-2/H-1158-2. The following table describes that reference kit, not a QLQ formulation or confirmed approval for plated zinc alloy. Validate adhesion and appearance on the actual finish before adoption.
| Component | Range | Typical | Function | Replenishment |
|---|---|---|---|---|
| E-1158-2 resin, supplied Part A | Fixed 3 mass parts; no published ratio adjustment range | 300 g; 75 wt% | Resin-side constituent of the matched doming system | Refill the isolated A reservoir with the same approved grade; record lot and recalibrate after refill. |
| H-1158-2 hardener, supplied Part B | Fixed 1 mass part; no published ratio adjustment range | 100 g; 25 wt% | Matched curing component | Refill the isolated B reservoir; independently verify delivered mass ratio. |
| Externally added pigment, filler, solvent, or catalyst | 0 unless separately supplier-approved | 0 g | Excluded from this clear-kit baseline | Never top up a mixed batch with additives or fresh material to extend usable life. |
The manufacturer lists Part A viscosity at 400–1,000 mPa·s and Part B at 70–120 mPa·s, both at 25°C, with pot life of 30–40 minutes for a 60 g sample at 25°C. These are product-specific references, not allowable drift bands for another resin. A 400 g batch can behave differently from the published 60 g test. Confirm its working time rather than scaling pot life linearly.
Published cured hardness is Shore A 80–90, with rated performance reached after seven days. These values are not measurements on plated hardware. Source: Fong Yong manufacturer reference.
3. Batch comparison and coupon qualification
During commissioning, collect 30 individually weighed consecutive shots at startup, mid-run, and near the approved working-time limit. Repeat across three material lots and representative fixture positions. Use fresh tared cups and preserve the shot sequence. Separately prepare plated coupons or production parts from the same shots for profile and adhesion assessment.
| Batch / coupon group | Test condition | n | Mean mass / SD | Calculated volume / bias / CV | Thickness, hardness, salt spray | Proposed decision |
|---|---|---|---|---|---|---|
| S1 / C1: nominal setup | Assumed 25°C; fresh mix; rho = 1.100 g/mL | 30 | 0.5500 g / 0.0030 g | 0.5000 mL / 0.00% / 0.55% | Not tested; retain matching coupons. | Quantity screen passes; cure approval pending. |
| S2 / C2: low-output challenge | Assumed 25°C; deliberately reduced displacement | 30 | 0.5225 g / 0.0030 g | 0.4750 mL / −5.00% / 0.57% | Not tested; inspect recess coverage. | Reject despite low variation. |
| S3 / C3: unstable-output challenge | Assumed 25°C; simulated intermittent air ingestion | 30 | 0.5500 g / 0.0150 g | 0.5000 mL / 0.00% / 2.73% | Not tested; inspect voids and profile. | Reject despite correct average. |
| P1–P3: actual qualification lots | Actual plated substrate, finish, cleaning, cure schedule, and exposure specification must be recorded | 30 shots per checkpoint | Awaiting measured data | Calculate from recorded mass and density | Measure profile; test hardness on suitable specimens; record agreed corrosion exposure and acceptance. | No product release until evidence is complete. |
For geometry illustration, 500 mm³ spread over 500 mm² gives a 1.00 mm average wet thickness. It does not predict central dome height. Measure the cured profile at fixed coordinates with a suitable optical or contact method. Do not take a durometer reading on a thin dome over rigid metal and report it as bulk resin hardness without a validated specimen method.
Salt-spray results require an agreed protocol: substrate and plating stack, exposure duration, whether a scribe is used, edge masking, and evaluation criteria. Compare resin-coated parts with uncoated controls from the same plating lot. Report blistering, edge lift, or corrosion separately. No corrosion hours or pass rates are claimed here because no test records exist.
4. Normal fluctuation bands versus intervention thresholds
These provisional limits govern a commissioning exercise, not resin chemistry in general. Replace them with approved limits after measurement-system evaluation and part trials. A danger threshold triggers containment; it does not establish that every affected part has failed.
| Parameter | Proposed normal band | Danger / hold threshold | Action and ownership |
|---|---|---|---|
| Mean shot volume | 0.490–0.510 mL for the 0.500 mL example | Outside ±3% of target | Process engineer checks displacement, leakage, and density before adjustment. |
| Shot CV, 30 shots | ≤1.0% | >1.5% | Maintenance checks air, valve response, nozzle obstruction, and pump refill. |
| A:B delivered mass ratio | Within ±1% relative to the approved 3.000 target | Outside ±2%; supplier may require tighter limits | Quarantine mixed output; verify each pump independently. |
| Material temperature | 24–26°C commissioning setpoint band | <22°C or >28°C for this study | Hold and requalify quantity and wetting; not a universal application-temperature limit. |
| Mixed material age | ≤50% of plant-validated usable time | ≥80%, or any viscosity/flow failure | Replace batch or mixer as appropriate; never rely solely on published pot life. |
| Mixed viscosity at fixed method | Within ±10% of approved fresh baseline | Outside ±20% | Check temperature, age, and ratio; do not dilute to recover output. |
| Feed pressure | Within ±5% of validated machine baseline | Outside ±10%, or unstable refill | Check supply restrictions and seals; absolute setpoint is equipment-specific. |
Trend mean and variation separately. Three successive subgroup means moving toward a limit warrant investigation even when each remains acceptable. Establish formal statistical control limits only from a stable baseline; specification limits are not control limits. Store temperature, resin age, pump events, and nozzle changes beside each subgroup so the team can distinguish correlation from cause.
5. Two worked management scenarios
Scenario A: correct repeatability, underfilled decorative recess
This is a hypothetical training scenario, not a customer case. S2 repeats consistently but deposits 5% too little. First compare weighed output with target, then inspect density entry, pump displacement, and leakage. Do not increase pressure automatically. If gravimetric output is correct while the dome remains low, investigate recess geometry and wetting. Contain production since the last valid checkpoint and release only after quantity and cured profile are reverified.
Scenario B: correct average, occasional voided badge
This is a second hypothetical scenario. S3 averages correctly but varies excessively. Inspect reservoir level, pickup immersion, pump suction seals, and the refill transition. Compare individual shot values with refill events and inspect coupons for entrained bubbles. Correct the identified mechanism, repeat the 30-shot sequence, and qualify restart behavior after an idle period. An average-only dashboard would conceal the defect mechanism.
For both scenarios, assign engineering responsibility for the approved recipe, maintenance responsibility for metering integrity, and quality responsibility for containment boundaries. Management should track first-pass yield, restart scrap, purge consumption, and overdue calibration separately. A faster cycle is beneficial only when those indicators remain controlled.
6. Engineer Notes
- Run a balance check with suitable traceable weights before sampling; isolate drafts and use a consistent tare procedure.
- Collect A and B separately using the equipment manufacturer’s safe verification procedure; confirm mass ratio before connecting the production mixing path.
- After refill, purge only the validated amount and test restart shots; log discarded mass instead of hiding it in resin consumption.
- Keep nozzle height, fixture coordinates, and dispense path revision locked; inspect edge overflow on representative plated parts.
- Start the mixed-material timer at first component contact; for in-line mixing, account for mixer residence and idle time.
- Use approved cleaning and handling methods on plated surfaces; prevent polishing residue, fingerprints, and incompatible solvent carryover.
- Follow component SDS controls and waste procedures; never use extra hardener or uncontrolled heating to rescue suspect material.
7. Shift Checks and traceable handover
| Shift stage | Check item | Frequency | Acceptance standard | Record |
|---|---|---|---|---|
| Before shift | Kit identity, lot, expiry, balance check | Each shift and material change | Approved matched kit; check within balance procedure | Lot register and balance log |
| Before shift | Separate component ratio and 30-shot baseline | Startup and recipe change | Approved ratio; provisional mean/CV limits above | Individual masses, temperature, operator |
| During shift | Quantity trend and cured-profile sample | Hourly initially; after refill, intervention, or restart | Approved volume and part drawing profile | Subgroup chart and coupon identifiers |
| During shift | Material age, feed condition, temperature | Continuous where instrumented; manual every 30 minutes | Validated working window; no air ingestion | Timer and machine event log |
| After shift | Final sample, retained coupons, containment status | Every handover | No unexplained drift; all suspect lots identified | Signed quality handover |
| After shift | Waste accounting and approved shutdown | Each shutdown | Mixed residue removed or handled per procedure | Waste mass, cleaning record, next-shift instructions |
8. Technician-to-AI FAQ
These are suggested technician prompts, not quotations from recorded customer conversations.
“AI, my dispenser repeats within 1%, but the resin stays soft. What should I check first?”
Separate quantity from chemistry. Verify A:B mass ratio, matched component identity, cure history, and mixing quality. Check both pump outputs; correct total mass can conceal an incorrect ratio. Quarantine affected parts and compare properly prepared witness specimens before adjusting the machine.
“AI, can I set a 3:1 resin recipe as 3:1 by volume on our machine?”
Not unless supplier data establish that equivalence. Convert using both component densities at operating temperature. The required volume ratio is 3 × rhoB / rhoA for a 3:1 mass recipe. Verify delivered masses after programming; reservoir markings are insufficient.
“AI, the average shot is correct, but the last parts after a pause have bubbles. Can we release the batch?”
Do not release from the average alone. Identify the pause boundary, inspect startup shots, and evaluate mixer age, suction air, and purge effectiveness. Segregate potentially affected parts. Quality must confirm visual integrity, profile, and applicable cured-performance requirements before release.
9. Evidence boundaries and next engineering decision
The local QLQ knowledge-base note 03-Equipment Technology / Company Catalogue / Machine Catalogue / Page 25.md lists silicone and PVC dispensing equipment. It provides no epoxy metering-accuracy or plated-hardware qualification data. Those equipment categories must not be treated as interchangeable resin systems. Actual machine suitability, usable time, adhesion, and corrosion performance remain to be confirmed.
What Would You Like to Solve?
Send the resin TDS, component densities, shot target, plated finish, recess drawing, and recent individual shot measurements to [email protected]. For planning the upstream and downstream process interfaces, consult turnkey surface-treatment line engineering and support. The next decision should be a documented qualification plan, not an unsupported accuracy promise.