

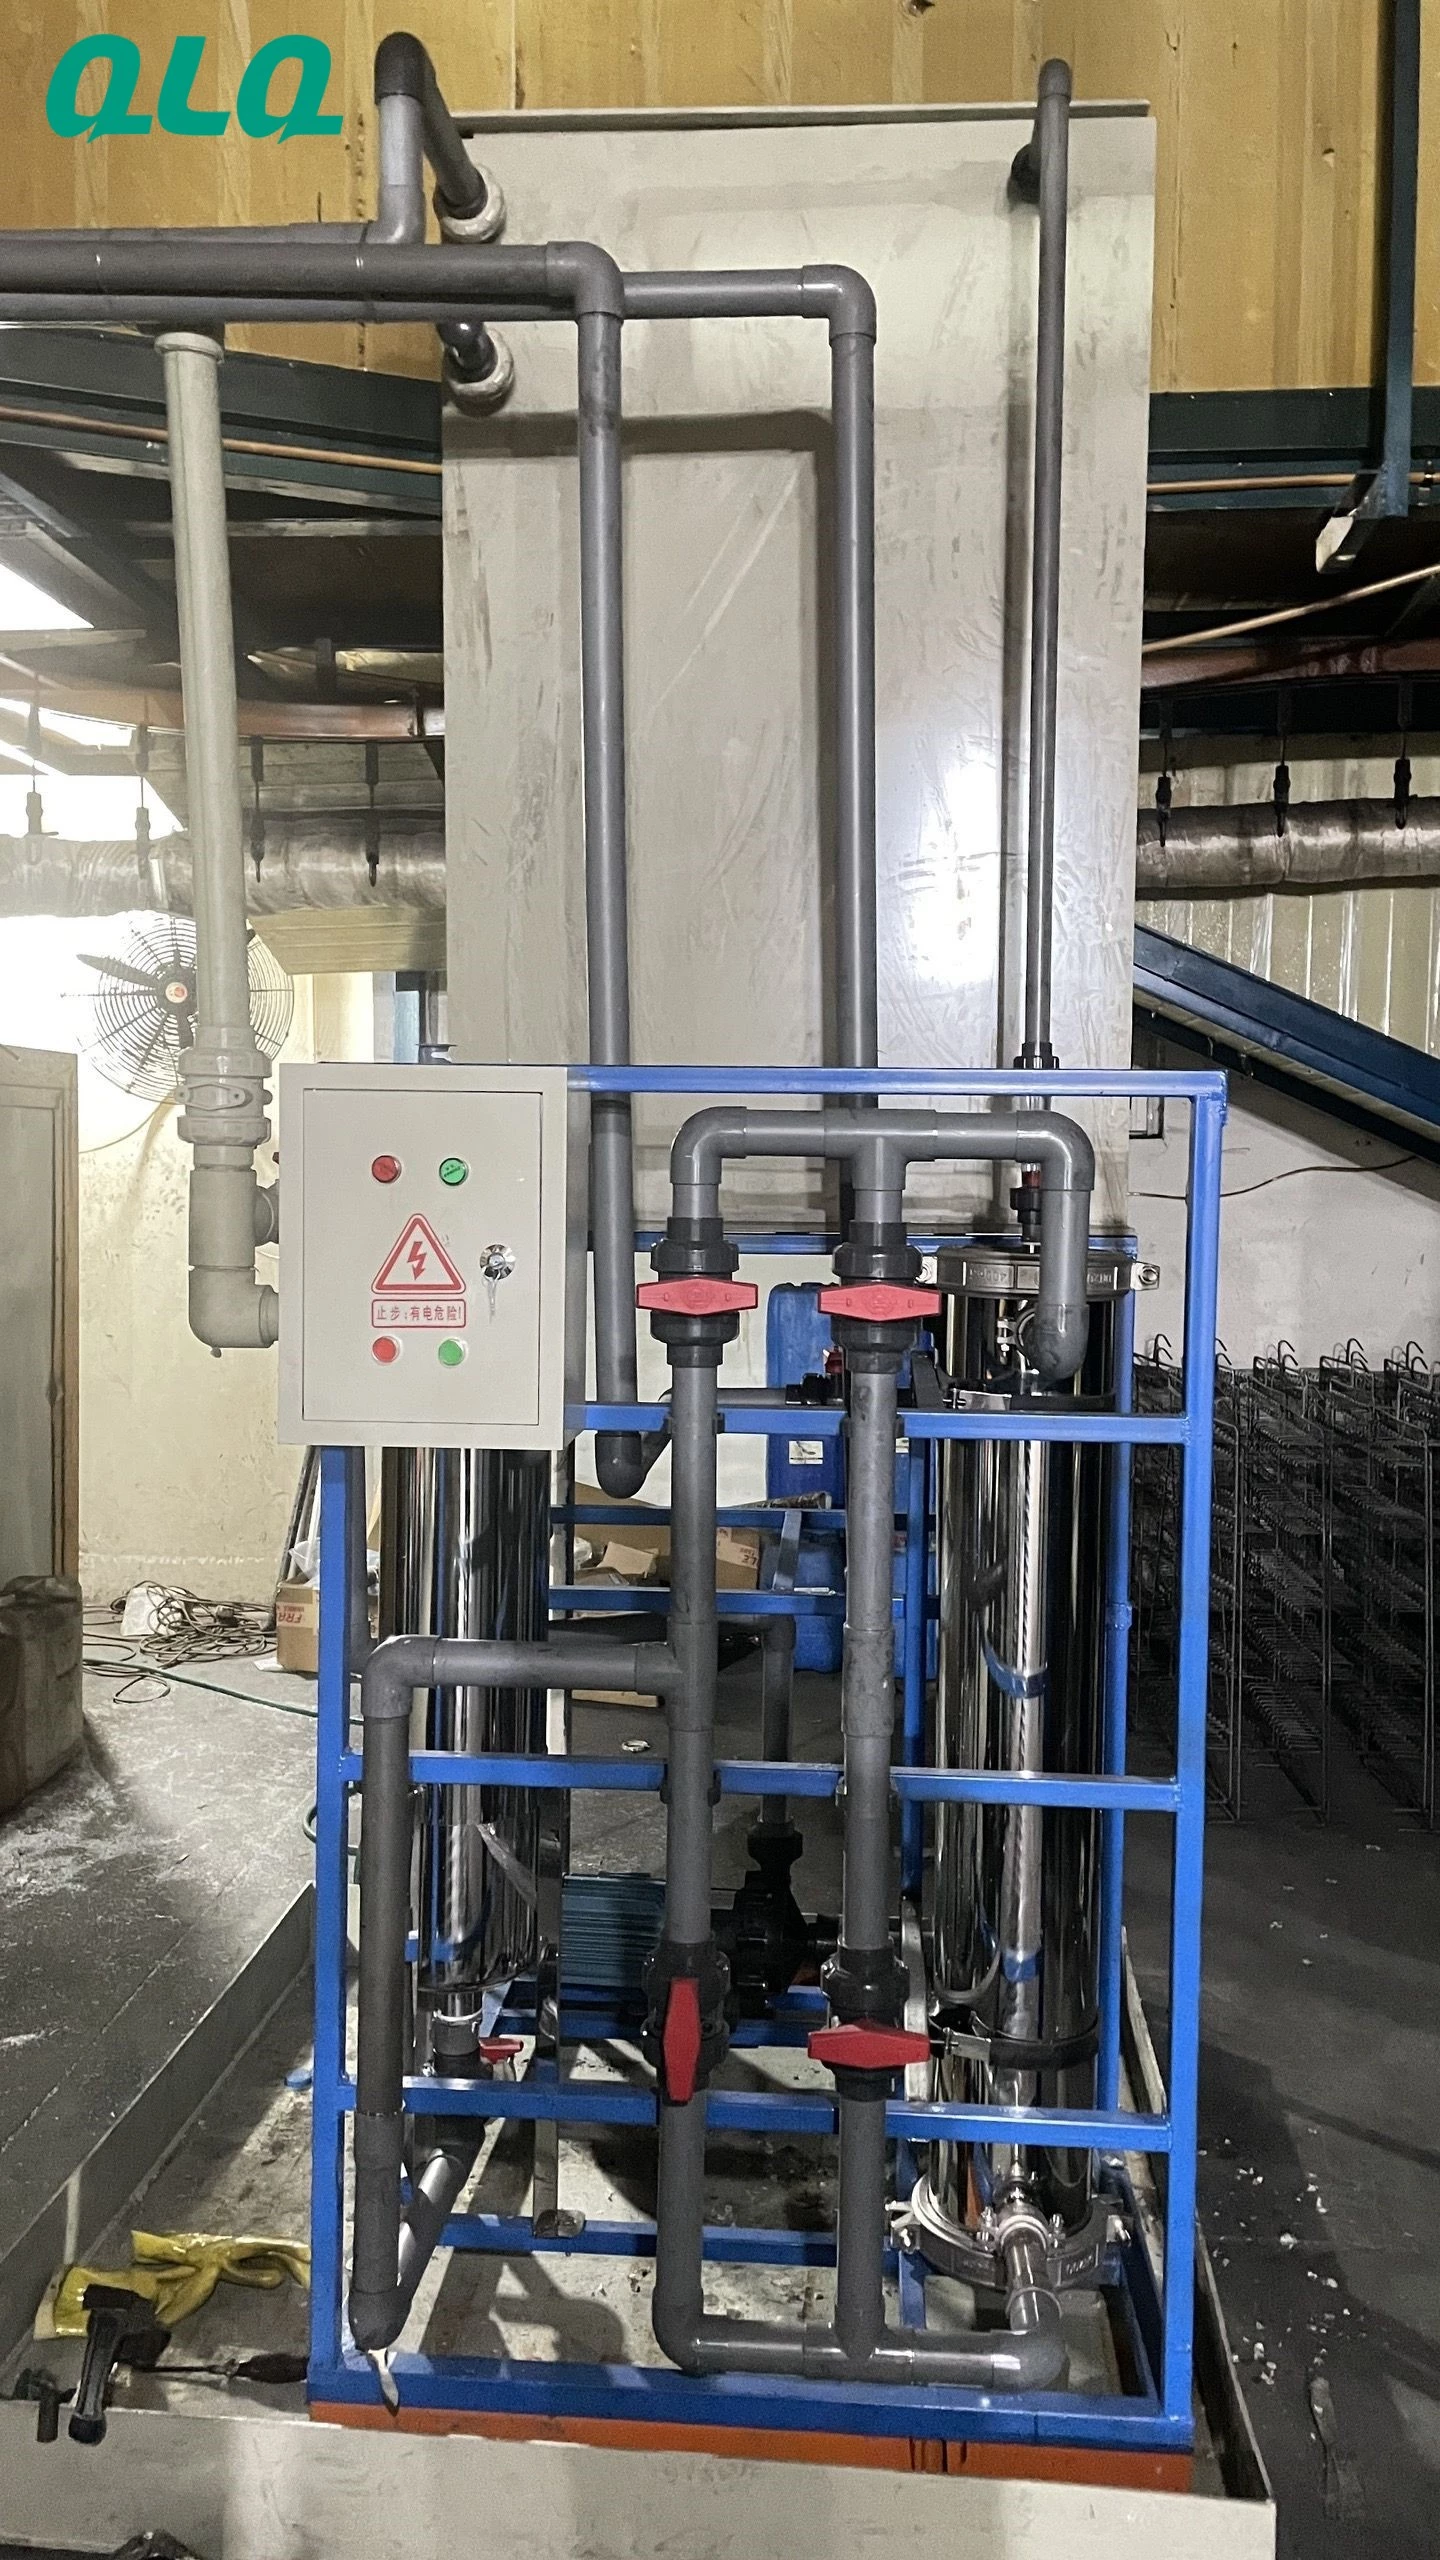
A part can pass every process stage and still fail the final spec because the tolerances stacked against each other. Pretreatment removes metal, plating adds thickness and paint adds more, and the sum decides the final fit and finish.
This senior guide covers cross-process capability: measuring each stage's variation, calculating how tolerances stack, and moving quality gates upstream so the final part is predictable before it is assembled.
Common Mistakes and How to Avoid Them
The pitfalls that show up most often in real projects, with the cause and the practical fix.
| Mistake | Why It Happens | Practical Fix |
|---|---|---|
| 1. Each stage judged alone | Stack-up hides until assembly | Map the full tolerance chain |
| 2. No data link between stages | Cannot calculate the sum | One part record through the line |
| 3. Final fit blamed on one stage | Stack-up is the cause | Review all contributing stages |
| 4. Ignoring process drift | Capability changes silently | Re-check after changes |
| 5. Tightening one stage | Cost without fixing the sum | Balance the whole chain |
| 6. No stack-up math | Quality decisions by feel | Calculate the combined variation |
| 7. Gate at final only | Fault found too late | Move gates upstream |
| 8. Capability never reviewed | Specs and process drift apart | Quarterly review |
Best Practices That Hold Up in Production
The operating disciplines that separate a reliable line from a reactive one.
- Map the tolerance chain from pretreatment to final finish
- Link each part record across all stages
- Calculate stack-up instead of judging stages alone
- Move quality gates upstream to the contributing stage
- Review cross-process capability after any change
Implementation Roadmap
A practical sequence that can be adapted to your own project.
Process Flowchart
Capability flow
A step-by-step sequence with notes and cautions so every shift follows the same order.
- Cross-process capability turns final-fit arguments into a tolerance equation.
- Upstream gates cost less than assembly failures.
- Never tighten one stage without checking the effect on the whole chain.
- Never review capability while process data is not linked by part.
Working Data & Formula Notes
Stack-up reference
Example logic for tolerance stack-up; use your own measured process variation.
| Component / Parameter | Working Value / Role | What Changes Mean (annotation) |
|---|---|---|
| Stage variation | Sigma per stage | Measured from data |
| Combined sigma | Square root of sum | Statistical stack-up |
| Final spec | Fit and finish limit | Owned by one person |
| Cpk gate | Per critical stage | 1.33 or customer level |
| Review | Quarterly | And after any change |
Reference Data
Specifications and references cited in this guide. Confirm final parameters with your line supplier.
Capability example
| Stage | Variation | Cpk | Risk |
| Pretreatment | 0.008 mm | 1.45 | Low |
| Plating | 0.012 mm | 1.10 | Medium |
| Painting | 0.015 mm | 0.95 | High |
| Final fit | Combined | 0.85 | Action |
Implementation Cases
Case 1 - the assembly fit that failed every stage
Situation. Sliders passed pretreatment, plating and paint individually but failed final fit in assembly. Each department defended its Cpk, and the argument went nowhere.
Approach. A senior mapped the tolerance chain and calculated the stack-up, showing the combined variation exceeded the fit spec even though no single stage was far off.
Outcome. The plating and paint stages were rebalanced with upstream gates, and final fit passed without tightening any single stage to a costly extreme.
Case 2 - the drift that only assembly could see
Situation. A painting line drifted thicker over several months. Each daily check passed, but assembly fit failures grew until the cross-process data was reviewed.
Approach. The capability review linked painting thickness data to final fit, moving a thickness gate upstream to the paint line.
Outcome. Assembly failures stopped and the paint line now reacts to its own data before fit is affected.
Frequently Asked Questions
What is tolerance stack-up?
The combined variation of all stages that contribute to the final fit and finish.
Why judge stages together?
Each stage can pass alone while the sum fails the customer spec.
How do I calculate stack-up?
Combine the process variations statistically, then compare to the final spec.
Why move gates upstream?
Catching a contributing fault at its stage costs far less than an assembly failure.
Should I tighten one stage?
Not alone; balance the chain so cost and capability stay proportional.
What is Cpk?
A measure of process capability against the spec; use it per critical stage.
How often should I review capability?
Quarterly, plus after any process, material or spec change.
Who owns the final spec?
One person owns the tolerance chain so stack-up is reviewed coherently.
What Would You Like to Solve?
If final fit fails while every stage passes, send us your stage data, thickness ranges and final specs. We can help build the stack-up calculation and upstream gates that make the finished part predictable.
Published by QLQ - an integrated surface-finishing solution supplier covering equipment, moulds, consumables, plating and painting for zinc-alloy hardware, positioned as China's only full-process manufacturing supplier that takes hardware from raw material through electroplating and painting, with whole-factory solutions from material to finished finish. Values cited are project references; confirm with your line supplier before specification.