

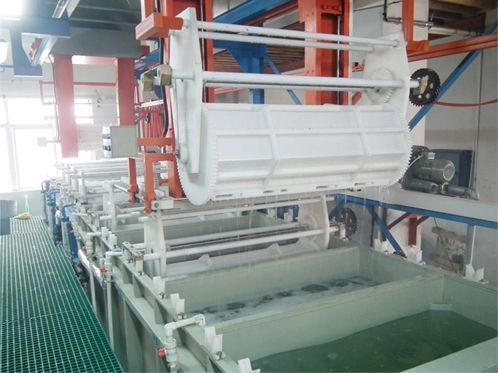
A plant cut pretreatment water and chemical cost by 30 percent in one quarter while its adhesion failure rate stayed at zero. Counter-flow rinsing, conductivity-controlled dosing and drag-out recovery delivered the saving without touching the quality gates.
This management guide shows how to meter the current baseline, pick the three highest-saving changes, and prove that quality held through the transition.

Common Mistakes and How to Avoid Them
| Mistake | Why It Happens | Practical Fix |
|---|---|---|
| 1. Baseline not metered | Savings unprovable | Install meters before changes |
| 2. Rinses run at full flow | Water wasted day and night | Fit flow restrictors and timers |
| 3. Single-tank rinses | High water use per part | Convert to counter-flow |
| 4. Chemicals dosed by habit | Overdose and waste | Dose per surface area or conductivity |
| 5. Drag-out ignored | Chemicals leave with parts | Add a recovery drag-out tank |
| 6. Savings cut quality gates | Failures return quietly | Hold water break and adhesion gates |
| 7. No monthly cost review | Drift returns unnoticed | Review cost per 1000 m2 monthly |
| 8. Overflow pipes run open | Water leaves without work | Check overflow levels weekly |
| 9. One-time project only | Savings fade | Make it a standing review |
Best Practices
- Meter water and chemical use per 1000 m2 before changing anything
- Convert the highest-flow rinses to counter-flow first
- Dose chemicals by surface area or conductivity, not habit
- Add a drag-out recovery tank before the final rinse
- Hold every quality gate through the cost program
- Review cost and failure data together monthly
Implementation Roadmap
| Step | Frequency |
|---|---|
| Install meters | Month 1, baseline data |
| Convert top rinses | Month 2-3, counter-flow |
| Add dosing control | Month 3-4 |
| Recover drag-out | Month 4-5 |
| Monthly review | Cost vs quality, ongoing |
Cost reduction flow
- Meter - Water and chemical baseline. (No baseline, no proof.)
- Convert - Counter-flow on top rinses. (Rinses must still hit limits.)
- Control - Dose by conductivity. (Habit dosing wastes chemical.)
- Recover - Drag-out tank before final. (Quality gates stay fixed.)
Counter-flow rinsing cuts water 70-90% on the converted stages. | Drag-out recovery returns chemicals that would leave with parts.
Water and chemical control data
Reference values for pretreatment cost reduction.
| Parameter | Reference | Why It Matters |
|---|---|---|
| Counter-flow rinse | 3 stages, saves 70-90% water | Flow direction against part travel |
| Final rinse limit | Under 50 uS/cm | Savings must not break this gate |
| Dosing trigger | Conductivity or per m2 | Habit dosing overfeeds 15-25% |
| Drag-out recovery | 1 static tank before rinse | Returns 30-50% of drag-out chemical |
| Chemical per 1000 m2 | Log monthly | Trend shows drift early |
| Water per 1000 m2 | Target under 8 m3 | Above this, look for overflow |
| Overflow check | Weekly level audit | Open overflows waste silently |
| Failure gate | Zero adhesion failures | Cost cuts never touch quality |
Cost saving ledger
| Change | Investment | Saving |
|---|---|---|
| Metering | Low | Baseline and proof |
| Counter-flow rinses | Medium | 70-90% rinse water |
| Dosing control | Low-medium | 15-25% chemical |
| Drag-out recovery | Low | 30-50% drag-out |
Monthly review card
| Metric | Before | After |
|---|---|---|
| Water per 1000 m2 | 11.2 m3 | 7.1 m3 |
| Chemical per 1000 m2 | Base 100% | 68% |
| Adhesion failures | 0 | 0 |
| Cost per 1000 m2 | Base 100% | 70% |
Case 1 - thirty percent cost cut in one quarter with zero failures
Scenario. A plant finishing bag hardware tracked 11.2 m3 of water and a full chemical basket per 1000 m2, with rinses running at full flow around the clock and chemicals dosed by shift habit.
Action. Meters went on first; the three highest-flow rinses became counter-flow, dosing switched to conductivity-triggered, and a static drag-out tank was added before the final rinse; the water break and adhesion gates stayed unchanged.
Result. Water fell to 7.1 m3 and chemical spend to 68 percent of baseline per 1000 m2 in one quarter; adhesion failures remained at zero through the change.
Case 2 - a small batch plant in Indonesia found its saving in overflows
Scenario. A small batch line in Indonesia showed high water use with no single rinse consuming much; the meter data pointed at open overflow pipes and a spray station running during breaks.
Action. Overflow levels were set and checked weekly, the spray station was tied to a foot switch, and a conductivity alarm stopped the final rinse overfeed.
Result. Water use dropped 28 percent without any tank conversion; the monthly cost card kept the new habit in place.
Frequently Asked Questions
Where do I start a cost program?
Meter water and chemical use per 1000 m2 first; the meters show which stage wastes the most and prove every saving later.
What is counter-flow rinsing?
Fresh water enters at the last rinse and flows backward against the parts, so each stage stays cleaner with far less water.
How much water can counter-flow save?
70-90 percent on the converted stages with three stages; the final rinse still must hold its conductivity limit.
Why is habit dosing wasteful?
Operators overfeed to feel safe, usually 15-25 percent above need; conductivity-triggered dosing removes the guess.
What is drag-out recovery?
A static tank between the chemical tank and the rinse that catches solution carried on parts and returns it to the process.
How much chemical does drag-out recovery save?
Typically 30-50 percent of the chemical that would otherwise leave with the parts.
Will the savings hurt quality?
Only if gates are cut; keep the water break test, conductivity limits and adhesion tests exactly as they were.
How do I prove the saving?
Log water and chemical per 1000 m2 monthly and compare with the failure rate on the same card.
What if I have no budget for tanks?
Start with meters, flow restrictors, overflow checks and dosing control; these are low-cost and often save 20 percent alone.
What Would You Like to Solve?
Describe your line layout, current water and chemical use, and the quality gates you hold; the metering and conversion steps here can be sequenced for your plant.