
Senior Technician Reference | Barrel Processing | Steel Phosphate Conversion Coatings
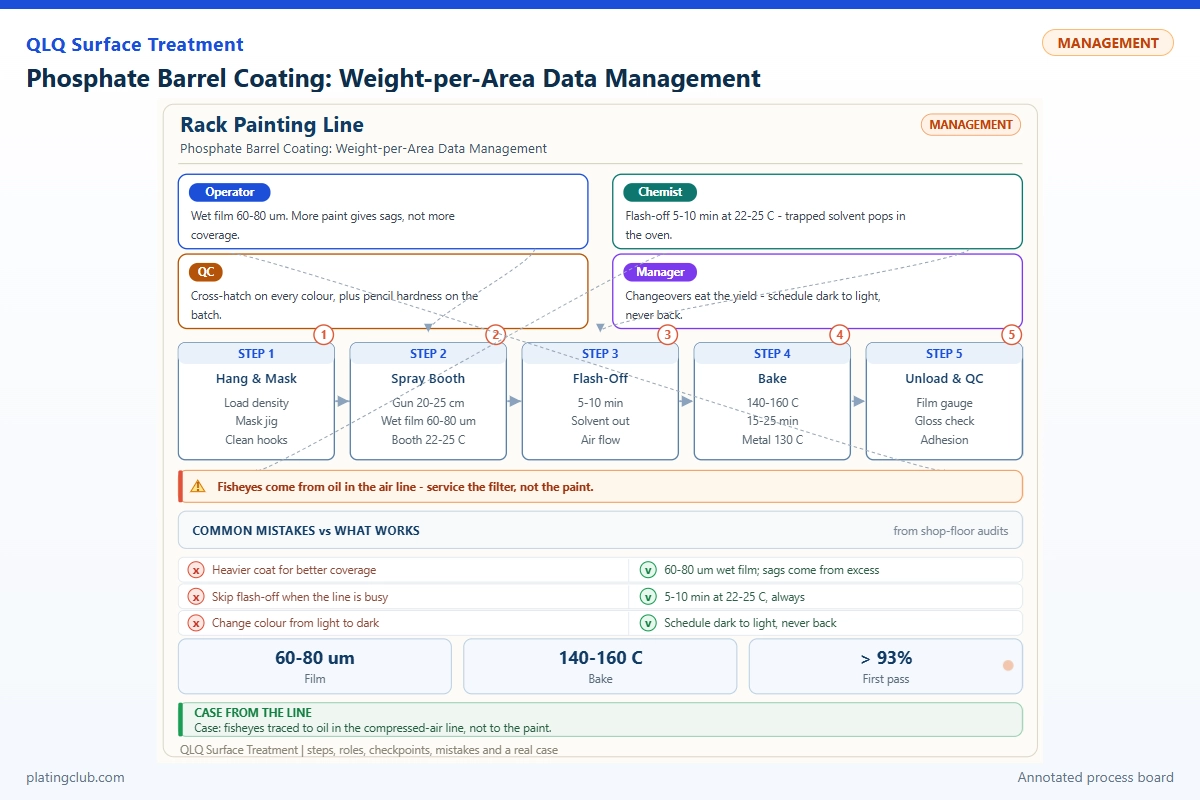
Phosphate Barrel Coating: Weight-per-Area Data Management
When phosphate coating weight changes, a senior technician must separate chemical drift from measurement drift and barrel-loading effects. A result of 3.0 g/m² is meaningful only when the exposed area, substrate, stripping procedure and drying condition are traceable. Otherwise, an apparent improvement can be retained sludge, a wrong area denominator or substrate dissolution during stripping.
Phosphating is chemical conversion, not electrodeposition: no cathodic current-density target belongs in this control plan. This article addresses low-carbon steel parts processed in a perforated rotating barrel before painting. Do not transfer the recipe to zinc-alloy sliders, aluminium or stainless steel without separate qualification. Distinguish paint-base zinc phosphate from heavy manganese phosphate used for different functional requirements.
The QLQ knowledge-base reference for steel phosphating gives 40–60°C, 5–15 minutes and 1–5 g/m². These broad ranges are not a product-specific operating instruction. The narrower windows below are proposed pilot controls. The formulation is an engineering screening composition, not a verified QLQ commercial formula; the numerical experiment is explicitly illustrative, not a customer test report.
1. Define the area before defining the target
Maintain a controlled area register for each part revision. Include both faces, edges and wetted internal surfaces; exclude deliberately masked areas. For a rectangular coupon, use A = 2lw + 2t(l + w), with consistent units. A 50 × 100 × 1 mm coupon has 10,300 mm², or 0.01030 m², including its edges. Calling it 0.01000 m² introduces a 3% coating-weight bias.
For production parts, use verified CAD area or a documented geometric model. Record whether holes, threads and recesses are included. Never substitute projected area, barrel-wall area or an unverified square-metres-per-kilogram factor. Establish separate factors for different sizes and revisions. Nested parts may have nominally wetted surfaces that receive poor solution exchange; nominal geometry cannot prove coverage.
Link every result to part number, steel grade, heat treatment, batch quantity, area revision, barrel identifier, fill level, rotation speed, cleaning history and chemistry sample time. Sample across the load, rather than collecting only easily accessible parts after unloading. Keep coupon data and actual-part data in separate series until their relationship is demonstrated.
2. Gravimetric measurement and uncertainty
Measure the dry coated mass mc, remove the conversion film using a validated substrate-compatible stripping method, then rinse, dry and measure ms. Calculate coating weight W = (mc − ms − b)/A, where masses are grams, A is square metres and b is the estimated substrate mass loss from a matching uncoated blank. Preserve both raw and corrected results. If blank correction dominates the film loss, investigate the method instead of accepting the corrected number.
Oil, sealer and loose sludge invalidate a simple phosphate-only mass result. Measure before post-treatment or validate how post-treatment is removed without attacking phosphate. Use identical drying and cooling routines, a clean weighing vessel and a balance checked with traceable weights. Confirm stable mass rather than weighing a warm or visibly wet coupon.
At 3.0 g/m², the example coupon carries about 30.9 mg of coating. A 0.1 mg balance is an appropriate starting resolution, but resolution is not total uncertainty. For independent inputs, approximate relative uncertainty as the square root of the sum of squared relative mass-loss and area uncertainties. Include blank variability and repeat stripping. Estimate repeatability before interpreting small shifts.
Do not convert coating weight to thickness using the density of bulk zinc phosphate. Conversion coatings are crystalline, porous and composition-dependent. Use cross-sections for local thickness when required; report the location and method separately. Consult a controlled copy of ISO 3892 for gravimetric methodology and confirm its applicable edition before issuing a laboratory procedure.
3. Working Data & Formula Notes
The following table defines one nickel-free zinc-phosphate screening bath on an analytical species basis. Values are realistic order-of-magnitude design inputs, not independently verified production limits. They do not establish acid balance or accelerator compatibility by themselves. Obtain the chemical supplier's complete make-up, titration and replenishment instructions before charging a production tank.
| Component | Range | Typical | Function | Replenishment |
|---|---|---|---|---|
| Zinc, expressed as Zn²⁺ | 1.0–2.0 g/L | 1.5 g/L | Metal source for zinc-phosphate crystals | Matched zinc-bearing concentrate, against zinc assay and acid balance |
| Total phosphate, expressed as PO₄ | 10–20 g/L | 15 g/L | Conversion-film source and acid-system constituent | Matched phosphate concentrate; verify total and free acidity afterward |
| Nitrate, expressed as NO₃⁻ | 2–5 g/L | 3 g/L | Oxidizing component of the selected accelerator system | Assay-controlled addition only within the supplier-approved system |
| Nitrite, expressed as NO₂⁻ | 0.05–0.15 g/L | 0.10 g/L | Accelerator controlling surface reaction and dissolved iron behaviour | Separate dilute feed after accelerator analysis; never mix concentrated feeds |
| Deionized water | Balance to working volume | Final tank volume | Solvent; controls concentration and evaporation correction | Restore marked volume before calculating chemical additions |
| Nickel, manganese, fluoride and organic additives | No deliberate addition in this screening design | 0 added | Excluded to keep the trial chemistry defined | Do not introduce another proprietary package during the trial |
Component figures are not raw-material weights: zinc oxide mass is not zinc-ion mass, and phosphoric acid mass is not phosphate mass. Acid strength, salt hydration and concentrate density matter. For a validated concentrate, addition volume equals bath volume multiplied by the concentration deficit, divided by the concentrate's active concentration, using consistent units. Recheck after mixing; phosphate precipitation and drag-out prevent a simple calculation from replacing analysis.
Cleaning, rinsing and any grain-refining activation are separate stages. Record their products and control sheets. Do not add cleaner or activator directly to the phosphate bath. Keep acidic concentrates segregated from incompatible materials, use the relevant SDS and site dosing procedure, and manage phosphate sludge and metal-bearing rinses through the approved waste route.
4. Trend bands and hold thresholds
These are proposed pilot alarm limits, not universal chemical failure thresholds. Validate them against the chosen chemistry and drawing. Establish statistical control limits from stable production separately from engineering acceptance limits; a statistically stable process can still make unacceptable parts.
| Parameter | Proposed normal band | Danger / hold threshold | Required response |
|---|---|---|---|
| Bath temperature | 48–52°C | Below 45°C or above 55°C | Hold loading; verify probe and heater before restarting |
| Immersion time | 8–12 minutes | Below 5 or above 15 minutes | Segregate affected load; inspect coverage and coating weight |
| Zinc assay | 1.3–1.7 g/L | Below 1.0 or above 2.0 g/L | Repeat analysis and check volume before dosing |
| Total phosphate assay | 13–17 g/L as PO₄ | Below 10 or above 20 g/L | Review replenishment and acid balance together |
| Nitrite assay | 0.08–0.12 g/L as NO₂ | Below 0.05 or above 0.15 g/L | Confirm method; adjust separate feed under approved instruction |
| Corrected coating weight | 2.0–4.0 g/m² | Below 1.0 or above 5.0 g/m² | Hold product; investigate measurement, cleaning and barrel exchange |
| Coupon replicate CV | At or below 10% | Above 15% | Check sampling, stripping and uneven treatment; do not hide scatter in the mean |
Trend free acidity, total acidity and their ratio using the supplier's defined sample volume, titrant and endpoints. Their numerical limits are pending confirmation: “points” from different methods are not interchangeable. Likewise, do not transplant a nickel-plating pH range into phosphating. Record cooled-sample temperature with pH, but use the approved acidity tests for replenishment decisions.
5. Experimental comparison: what the data can establish
This is a synthetic training dataset for designing a real experiment. It demonstrates calculations only; none of the values represents measured QLQ performance. Use three independently sampled coupons per condition, a stripping blank for each series and actual barrel parts alongside coupons. Keep substrate, cleaner, activator and rinsing constant.
| Trial / sample | Test condition | Area | Mean gross loss / blank | Corrected weight, n = 3 | Thickness / salt spray |
|---|---|---|---|---|---|
| A / coupon baseline | 50°C; 10 min; fixed coupon exposure | 0.01030 m² each | 31.9 / 1.0 mg | 3.00 g/m²; simulated range 2.90–3.10 | Not measured / not tested |
| B / lower temperature | 45°C; 10 min; otherwise unchanged | 0.01030 m² each | 21.6 / 1.0 mg | 2.00 g/m²; simulated range 1.85–2.15 | Not measured / not tested |
| C / higher load challenge | 50°C; 10 min; increased barrel fill; actual-part sample | 0.02000 m² sample total | 42.0 / 2.0 mg | 2.00 g/m²; simulated range 1.40–2.60 | Not measured / not tested |
| D / time extension | 50°C; 15 min; baseline load restored | 0.01030 m² each | 42.2 / 1.0 mg | 4.00 g/m²; simulated range 3.80–4.20 | Not measured / not tested |
Trial A gives (0.0319 − 0.0010)/0.01030 = 3.00 g/m². Trial C deliberately changes sample geometry: its mass loss cannot be compared directly with A. Also, increased scatter can be more diagnostic than a reduced mean. An extended dwell producing more phosphate does not demonstrate better paint adhesion or corrosion protection.
For the real validation, record painted film thickness, paint identity, cure history and post-treatment. If neutral salt spray is specified, document the applicable ISO 9227 or ASTM B117 procedure, exposure duration, scribe condition, edges, replicate count and evaluation method. These tests do not supply a universal acceptance duration. Leave corrosion and hardness cells blank until measured; never infer salt-spray hours from coating weight.
6. Two diagnostic implementation scenarios
Scenario A: acceptable coupons, variable barrel parts
This is a troubleshooting scenario, not a reported customer case. If stationary coupons remain consistent but nested steel clips show bare contact zones, first compare load geometry and solution exchange. Run a controlled smaller load with unchanged chemistry, photograph suspect contact areas and retain samples from each load. Check blocked perforations and actual barrel motion. Recovery with reduced nesting supports a mechanical explanation; it does not justify increasing acid or accelerator.
Scenario B: coating weight rises after laboratory changes
If the whole chart shifts after a new operator or stripping batch, quarantine the interpretation before correcting the tank. Repeat a retained reference using the old and new laboratory conditions, include blanks and inspect for residual sludge. A larger blank loss or changed drying endpoint indicates measurement drift. Retest affected production with the validated method; preserve original entries and append corrected results with an audit trail.
7. Engineer Notes
- Freeze the part-area revision before trials; independently check the coupon dimensions and unit conversion.
- Restore bath volume, mix, then sample away from dosing and sludge zones before calculating replenishment.
- Run an uncoated substrate blank with every stripping series; reject an unstable blank correction.
- Record barrel fill and speed with each sample; change only one loading variable per diagnostic trial.
- Inspect washed parts for sludge before weighing; retain photographs of powdery or contact-marked surfaces.
- Keep phosphate-only measurements separate from oiled, sealed and painted specimens in the database.
- After any hold, release only documented affected batches against the drawing and qualified test plan.
8. Shift Checks
| Shift stage | Check item | Frequency | Acceptance standard | Record |
|---|---|---|---|---|
| Before shift | Volume, temperature, barrel and perforations | Before first load | Marked volume; proposed 48–52°C; unobstructed motion | Start-up checklist and probe identifier |
| Before shift | Acidity, zinc and accelerator | Before release to production | Approved supplier limits; pilot assay bands where validated | Raw titration, assay, method revision |
| During shift | Dwell, fill, rotation and batch identity | Every load | Qualified loading recipe and proposed 8–12 min dwell | Batch traveller with actual values |
| During shift | Coating weight and sample appearance | First load, after correction, then validated sampling interval | Drawing requirement; pilot 2–4 g/m²; no loose sludge | Raw masses, area revision, blank and replicates |
| During shift | Chemistry after addition | Every chemical adjustment after full mixing | Approved chemistry and acidity balance restored | Addition quantity, time and repeat analysis |
| After shift | Sludge, trend review and held batches | Every handover | No unresolved alarm released; cleaning actions assigned | Handover log, disposition and retained sample IDs |
9. Technician-to-AI FAQ
Suggested troubleshooting prompts below are not quotations from customer records.
“AI, our phosphate weight increased but paint adhesion got worse. What should I check first?”
Check sludge retention, coarse or poorly anchored film, inadequate rinsing and paint cure before changing the phosphate target. Compare validated gravimetry with microscopy and the specified adhesion test on matched specimens. More mass is not automatically better coverage.
“AI, can I compare coating weight across two steel part numbers using grams per kilogram?”
Only after validating a separate area-per-kilogram factor for each revision. Report g/m² for coating control and retain g/kg only as a consumption metric. Different thicknesses and holes change the conversion; batch mass alone cannot establish exposed area.
“AI, the coupons pass but our barrel batch fails. Should I increase accelerator?”
Not without an assay. First verify nesting, fill, solution exchange, cleaning and the representativeness of coupon exposure. Compare reduced-load actual parts under unchanged chemistry. Accelerator additions cannot reliably fix mechanically shielded surfaces and may destabilize a sound bath.
10. Reference boundary and engineering support
Internal reference: QLQ knowledge base, product knowledge / IMA company-level extracts / note 035, Process Steps. It supports only the broad steel-phosphating temperature, time and coating-weight ranges cited above. A verified commercial formulation, acidity endpoints and real batch-performance records were not available in that note and remain pending confirmation. Obtain controlled test standards and supplier instructions before production use.
What Would You Like to Solve?
Send the steel grade, part-area calculation, barrel loading, chemical control sheet and raw weighing records to [email protected] for a focused engineering discussion. For equipment, chemistry and process-support scope, see turnkey surface-treatment lines and technical support. A useful review starts with traceable measurements, not an unsupported coating-weight target.