
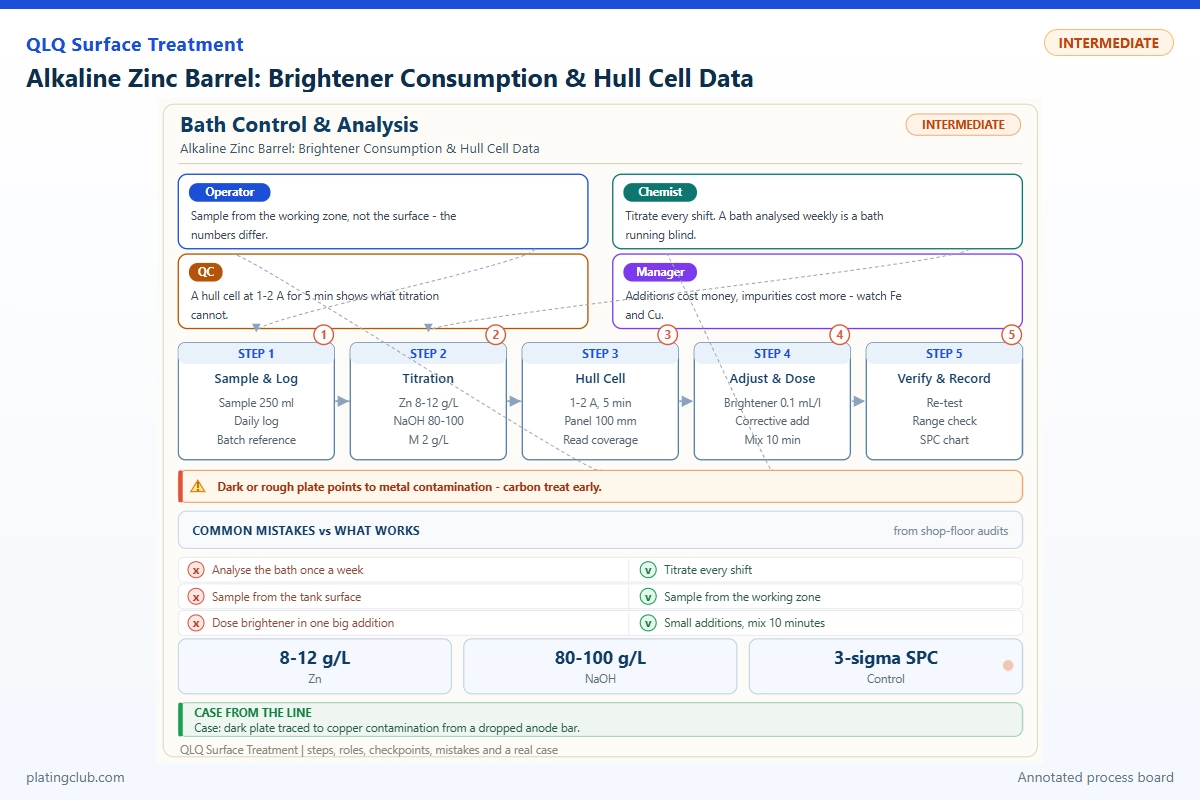
Alkaline Zinc Barrel: Brightener Consumption & Hull Cell Data
When an alkaline zinc barrel becomes dull, the useful question is not simply “how much brightener should I add?” It is whether additive demand changed, the base electrolyte drifted, or the barrel stopped delivering consistent current and solution exchange. Intermediate technicians need a repeatable sequence that separates these causes before changing a production tank.
This guide covers cyanide-free zinc deposition on suitable steel components, including small fasteners and steel bag hardware. It is not a direct-plating instruction for zinc-alloy die castings. Substrate identification, pretreatment qualification and any hydrogen-embrittlement controls must be settled before trials.
Evidence boundary: published panel results below are external research, not QLQ customer tests. Arithmetic examples are illustrative. Proposed control limits require approval against the actual chemical supplier's technical data sheet; no universal brightener consumption rate is assumed.
Working Data & Formula Notes: Keep One Chemistry System
The following complete reference bath uses the manufacturer's ZN-100 cyanide-free formulation. “Typical” values are selected commissioning targets inside its stated ranges, not additional manufacturer claims. Proprietary additives must come from the same qualified system; their mass concentrations cannot be converted into another supplier's millilitres per litre.
| Component | Range | Typical | Function | Replenishment |
|---|---|---|---|---|
| Zinc oxide, ZnO | 9–12 g/L | 10.5 g/L | Zinc source after dissolution as zincate | Analyse dissolved zinc; restore through the approved zinc dissolution system or prepared concentrate. |
| Sodium hydroxide, NaOH | 100–130 g/L | 115 g/L | Alkaline electrolyte and zincate stability | Titrate using the supplier method; correct in cooled, controlled increments. |
| ZN-100 proprietary brightener | 4–8 g/L | 6 g/L | Deposit appearance and grain control | Use qualified ampere-hour feed with panel confirmation; do not dose by appearance alone. |
| Compatible alkaline-zinc throwing-power agent | Optional; manufacturer lists 4 g/L | 4 g/L if specified | Distribution support | Confirm whether required; maintain only by its own approved analysis or trial method. |
| Demineralized water | To final working volume | Measured tank datum | Solvent and volume control | Restore evaporative loss before interpreting concentrations; track drag-out separately. |
| Sodium cyanide | 0 added | 0 | Excluded from this process | Never introduce cyanide chemicals or contaminated transfer equipment. |
Source: Fengfan ZN-100 formulation and operating information. The listed barrel envelope is 0.5–3 A/dm2 and 6–8 rpm, with a broad 5–40°C bath envelope. These are supplier-specific, not universal settings.
Do not confuse ZnO with zinc metal: 10.5 g/L ZnO corresponds theoretically to approximately 8.44 g/L Zn, using 65.38/81.38 as the mass factor. Analyse the actual bath rather than inferring its present zinc content from old make-up records. Avoid using pH as the principal caustic control in this concentrated alkaline electrolyte; use the specified titration.
Brightener Consumption: Separate Feed from Loss
An ampere-hour total records electrical throughput, not chemical condition. Calculate throughput from actual current integration, including interrupted cycles. Keep maintenance additions, make-up additions and recovery additions in separate ledger fields. Otherwise, a corrective overdose becomes tomorrow's misleading “normal consumption.”
Q = sum(I × elapsed hours); apparent feed rate = added brightener volume / Q
Illustrative calculation: 240 A for 1.5 hours gives 360 Ah. Feeding 54 mL gives 0.15 mL/Ah, or 1.5 L/10,000 Ah. This is arithmetic only, not a recommended rate. A liquid-product ledger needs product density before conversion to the mass-based concentration in the reference formulation.
Check the drag-out contribution independently. For example, losing 20 L from a bath containing 6 g/L commercial product removes approximately 120 g of that product. Water top-up restores volume, not those additives. Conversely, evaporation concentrates dissolved chemicals without carrying them out. Confusing these losses causes systematic overfeeding or underfeeding.
Compare several stable shifts using the same product geometry, loading and thickness requirement. Investigate a rate change alongside drain time, rejected loads, temperature, tank transfers and feed-pump calibration. Only establish a baseline after chemistry, panels and production thickness agree. Feed demand is not proof of molecular decomposition or cathodic consumption.
Hull Cell Method: Make the Comparison Reproducible
Use a fixed written method: identical cell volume, panel material, pretreatment, anode, current, duration, temperature and agitation. A supplier's production-control procedure takes precedence. Record every difference; a changed test method can resemble a changed bath.
- Restore tank volume, mix thoroughly, and collect a representative sample away from a recent addition point. Record zinc, caustic, temperature and accumulated Ah.
- Divide the sample into an untreated control and independent trial aliquots. Never keep adding chemicals to the same aliquot and call the resulting panels equivalent experiments.
- Use a measured dilution for tiny additive trials. Calculate concentration from the actual cell volume and include the dilution factor.
- Photograph panels under fixed lighting before passivation. Mark current-density direction and measurement positions; use the appropriate scale for that cell geometry.
- Check thickness and adhesion as well as gloss. Repeat the smallest successful addition in a fresh aliquot, then qualify a production load.
For a 267 mL sample, 0.10 mL neat product represents approximately 0.375 mL/L. In a hypothetical 2,000 L tank that concentration change corresponds to 750 mL. This scaling calculation is not authorization to add 750 mL: confirm compatibility and trial reproducibility, obtain approval, and introduce the correction in controlled stages with adequate mixing.
Published Experimental Data: Brightness Is Not Thickness
These selected results come from Yuken's EP2489762A1, Table 2 and test methods. The electrolyte contained 12 g/L zinc and 120 g/L NaOH; additive identities are specific to that patent. Do not substitute these polymers into the reference commercial bath.
| Panel / additive | Test condition | Average thickness | HCD / LCD thickness | HCD/LCD | Appearance / bend result |
|---|---|---|---|---|---|
| Example 2: B, 2.50 g/L | 267 mL; 2 A; 10 min; 25°C; steel panel; brightener I 0.05 g/L | 3.91 | 4.48 / 3.22 | 1.39 | Bright; no peeling |
| Example 3: C, 2.50 g/L | Same conditions | 3.06 | 3.25 / 2.78 | 1.17 | Bright; no peeling |
| Comparative 1: D, 2.50 g/L | Same conditions | 1.00 | 1.05 / 1.03 | 1.02 | Bright; no peeling |
| Comparative 3: no additives | Same cell, current, time and temperature; no brightener | 7.44 | 8.67 / 2.70 | 3.21 | Coarse; peeling |
HCD and LCD were measured 20 and 80 mm from the high-current end. Salt-spray and hardness results were not reported in this comparison. These are laboratory panels, not barrel-batch acceptance data.
The practical lesson is to keep distribution, minimum thickness and appearance as separate release criteria. A visually attractive panel can still fail your drawing. Do not derive a production cycle time from these laboratory thicknesses. Record production measurements at specified locations on representative parts, especially recesses and contact-shadowed surfaces, using a calibrated method suitable for their geometry.
Trend Bands and Intervention Thresholds
Below is a proposed shop-control plan, not a list of universal defect-onset values. Chemistry bands are deliberately narrower than the reference supplier envelope. Crossing an intervention threshold means stop automatic correction, investigate and obtain engineering disposition; it does not prove a particular defect mechanism.
| Parameter | Normal working band | Danger / intervention threshold | Response |
|---|---|---|---|
| ZnO equivalent | 10–11 g/L | <9 or >12 g/L | Verify zinc analysis and dissolution control. |
| NaOH, supplier analytical basis | 110–120 g/L | <100 or >130 g/L | Repeat titration; check volume before correction. |
| Reference brightener product | 5–7 g/L, if measurable | <4 or >8 g/L; or failed approved panel | Use validated analysis or panel trials; never infer concentration from gloss. |
| Temperature | 22–28°C, proposed trial band | <20 or >30°C: internal alert | Restore qualified temperature before additive trials. |
| Average part-area current density | 0.8–1.5 A/dm2, proposed | <0.5 or >3 A/dm2 | Check area estimate and contacts; inspect actual current trace. |
| Barrel rotation | 6–8 rpm for reference process | Outside that band, or any stall | Check drive, loading and tumbling; isolate stalled load. |
| Apparent additive feed | 0.8–1.2 × qualified baseline | <0.7 or >1.3 × baseline for two comparable shifts | Calibrate pump and audit losses before changing feed factor. |
Monitor carbonate and contamination against supplier limits as additional trends. Without a verified limit for the chosen system, mark the field “requires supplier confirmation,” not an invented maximum. Do not transfer acidic-zinc or nickel pH windows into an alkaline zinc control sheet.
Two Troubleshooting Scenarios
Scenario 1: Dull recesses with a satisfactory control panel
This is an illustrative investigation, not a documented customer case. Steel clips show thin recesses while the bath panel matches its approved reference. Freeze brightener feed changes. Compare barrel fill, rotation, perforation blockage and dangler condition with a successful load. Run a matched loading trial and measure the same recess locations. Improvement after restoring contact or tumbling identifies a delivery problem; adding brightener would have obscured the comparison.
Scenario 2: Addition restores gloss but the cycle becomes longer
Again, this is a diagnostic scenario, not a claimed plant outcome. Compare untreated and staged-addition panels for deposited thickness, not just brightness. Check whether recent top-ups included both make-up and automatic feed. Audit tank volume and metering accuracy. If deposition falls as additions rise, hold further additions and ask the supplier to assess additive balance. Do not jump directly to carbon treatment, which can remove required additives as well as contaminants.
Engineer Notes
- Calibrate each dosing pump by collecting a timed output into a compatible graduated vessel; compare delivered volume with its programmed command.
- Label control and trial panels with sample time, temperature, Ah, dilution, dose and technician initials; retain the untreated control.
- Inspect danglers and contacts under safe electrical isolation. Log current interruptions instead of hiding them in a cycle-average reading.
- Use a graduated tank datum before sampling. Reanalyse after mixing any approved correction rather than immediately collecting near the feed point.
- Keep acid cleaners and plating-sample tools separate. Use dedicated compatible containers to prevent accidental contamination.
- For caustic additions, follow the SDS, use splash protection and cooling, and add chemical slowly to water under the approved procedure; prevent hydrogen accumulation around zinc dissolution equipment.
- Quarantine suspect loads until minimum thickness and adhesion pass. Escalate high-strength steel to the approved embrittlement-control procedure; brightness does not demonstrate safety.
Shift Checks
| Shift stage | Check item | Frequency | Acceptance standard | Record |
|---|---|---|---|---|
| Before shift | Volume, zinc, caustic, temperature | Each shift before release | Approved control bands; repeat anomalous analysis | Tank datum, raw titration and calculated result |
| Before shift | Control panel and feed-pump delivery | Panel each shift; pump after adjustment and scheduled calibration | Qualified panel; delivery within site's validated tolerance | Panel ID, measured output and pump setting |
| During shift | Current trace, load, rotation | Every batch; current monitored throughout | Qualified recipe; no unexplained interruption or stall | Batch ID, area estimate, Ah and exceptions |
| During shift | Thickness and appearance | First batch; after correction; approved sampling thereafter | Drawing minimum at specified sites; approved appearance | Individual readings, location map and disposition |
| During shift | Temperature and chemical additions | Continuous temperature; every addition | Qualified band; authorised product and dose | Trend, lot number, dose, reason and approval |
| After shift | Ah/feed balance and losses | Each handover | Baseline trend explained; no unlogged correction | Starting/ending totalisers and loss ledger |
| After shift | Retained samples and unresolved holds | Each handover | Traceable samples; every held batch assigned an owner | Sample IDs, panel images and next actions |
FAQ: Questions a Technician Might Ask an AI
“My alkaline zinc barrel parts are dull, but the Hull cell is bright. Should I add more brightener?”
Not on that evidence alone. First compare load geometry, contacts, rotation, cleaning and minimum thickness with a successful batch. A panel lacks intermittent barrel contacts. Use a matched mechanical trial before changing bath chemistry.
“How do I calculate the tank addition from 0.1 mL in my 267 mL Hull cell?”
Divide 0.1 by 0.267 to obtain approximately 0.375 mL/L, then multiply by measured tank litres. Account for any dilution. Confirm the result in a fresh sample and obtain approval before staged dosing; laboratory scaling does not establish a safe production dose.
“Can a brighter zinc deposit prove that my salt-spray requirement will pass?”
No. Verify thickness, pretreatment, passivation, sealer, curing and handling through the agreed finished-part test plan. Record coating stack, conditioning, test method and separate white- and red-corrosion endpoints. No salt-spray hours can be inferred from these panel data.
What Would You Like to Solve?
For a useful engineering review, provide the substrate, part geometry, barrel loading, current trace, zinc and caustic analyses, chemical product identities, dosing history, untreated panel images and minimum-thickness readings. Send the evidence to [email protected], or review the scope of integrated surface-treatment equipment, chemistry and technical support. The objective is to identify the limiting variable and qualify a correction, not simply increase chemical consumption.
Internal grounding: QLQ Obsidian knowledge-base note, Electroplating Brighteners and Additives (English translation of the source filename), in the surface-treatment process collection. It supports analysing base salts and checking additions with Hull-cell trials; it does not supply the reference zinc formulation or the published test results. Those external sources are linked alongside their tables.