

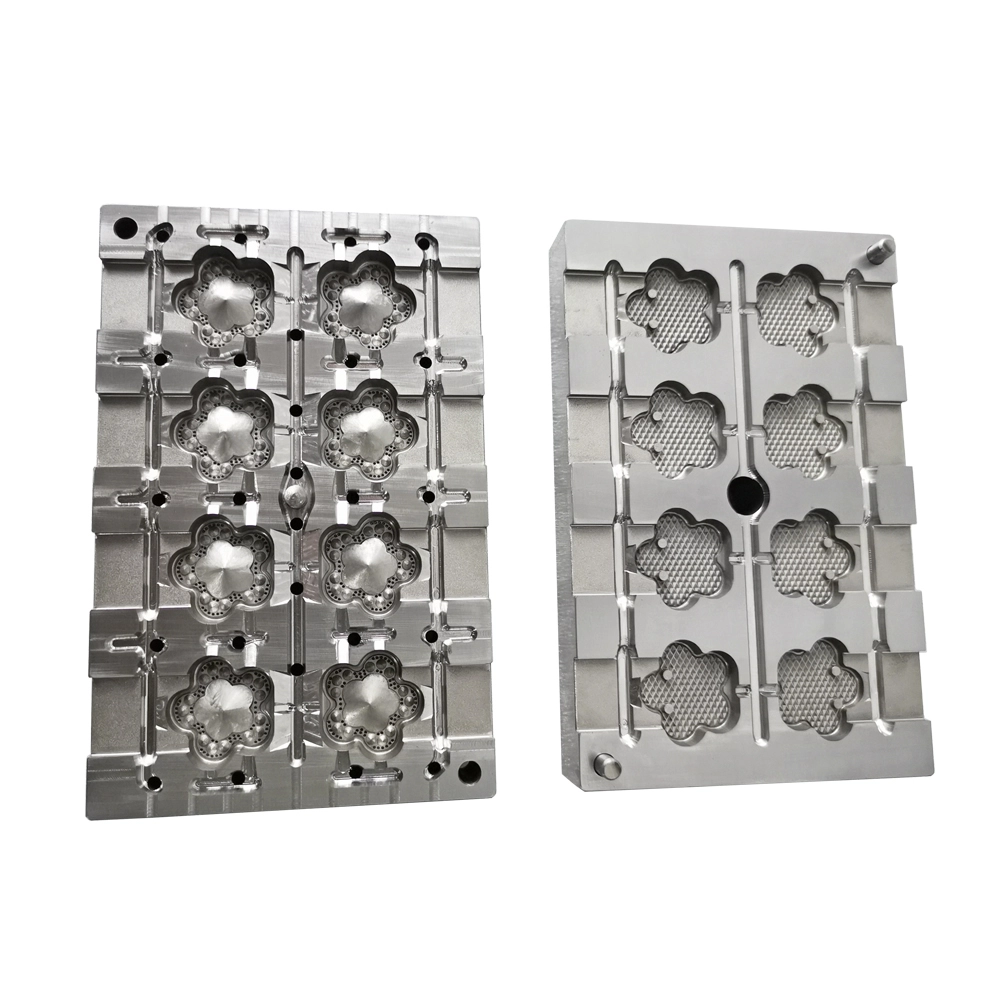
Mould faults caused 25 percent of all downtime on a zinc line, and every break-in was fixed ad hoc with no history. A card per mould, service by shot count and a weekly review cut mould downtime 40 percent in three months.
This management case guide covers the toolroom card system, shot-count maintenance and the review rhythm that keeps it running.


Common Mistakes and How to Avoid Them
| Mistake | Why It Happens | Practical Fix |
|---|---|---|
| 1. No mould history | Same fault re-fixed | One card per mould |
| 2. Service by failure | Breakdowns drive the week | Trigger by shot count |
| 3. Spares not stocked | Repairs wait on parts | Stock 80% of critical parts |
| 4. Faults not logged | Trends invisible | Log every repair and time |
| 5. Repairs untested | Fault returns next shift | Gate 10 shots after repair |
| 6. Downtime not measured | Improvement unprovable | Track by cause weekly |
| 7. Cards updated late | Data goes stale | Update at the repair, not the month |
| 8. Moulds treated equally | Wrong priorities | Rank by downtime share |
| 9. No owner | System fades in a month | Name a card owner per mould |
Best Practices
- Keep one card per mould with shots, faults and spares
- Trigger service by shot count, not failure
- Stock the critical spares that fail most
- Log every repair with time and cause
- Gate test shots after every repair
- Review the downtime board weekly with owners
Implementation Roadmap
| Step | Frequency |
|---|---|
| Open cards | One per mould, one-time setup |
| Log repairs | Every event, same day |
| Review board | Weekly, per cause |
| Stock spares | Monthly, top failures |
| Update cards | After every repair |
Toolroom card flow
- Card - Shots, faults, spares per mould. (No history means re-fixing the same fault.)
- Trigger - Service by shot count. (Failure-based service stops the line first.)
- Repair and log - Time, cause, parts used. (Late logs poison the trend.)
- Review - Weekly board, named owners. (No review, no system.)
Mould downtime follows history, not luck. | A stocked spare cuts repair time more than a fast fitter.
Toolroom control data
Reference values for mould maintenance management.
| Parameter | Reference | Why It Matters |
|---|---|---|
| Service trigger | Every 20k-50k shots per mould | Set per mould class and wear rate |
| Card fields | Shots, faults, spares, next service | Written at the repair, not later |
| Spare stock | Top 20% of parts = 80% of failures | Stock what fails most |
| MTBF target | Over 30,000 shots | Baseline here was 18,000 |
| Repair gate | 10 test shots after repair | Proves the fix before the line |
| Downtime review | Weekly, per cause | Trends beat anecdotes |
| Downtime KPI | Under 5% of available time | Measured, published, owned |
Mould downtime board
| Mould | Downtime hours | Top cause | Owner |
|---|---|---|---|
| Slider A | 12 | Ejector pins | Toolroom lead |
| Frame B | 8 | Parting flash | Toolroom lead |
| Puller C | 3 | Spare wait | Stores |
| Total | 23 | Review Friday | Manager |
Case 1 - mould downtime cut 40% in three months
Scenario. Mould faults caused 25 percent of all downtime on a zinc line. Every break-in was fixed ad hoc, the same ejector pin fault returned monthly, and repairs waited on parts that were not stocked.
Action.
Result.
Case 2 - one card system across three plants
Scenario. A group with three plants ran identical moulds with completely different maintenance; the worst plant had triple the mould downtime of the best.
Action.
Result.
Frequently Asked Questions
Why a card per mould?
History is the only way to see recurring faults; the same ejector pin fault returned monthly until it was logged.
What goes on the card?
Shot count, fault history, spares used, next service date and the repair time.
How often should I service?
By shot count, about every 20k-50k shots depending on the mould class and wear rate.
Do I need software?
No - a paper card and a weekly board run the system; software comes later if it earns its cost.
Which spares to stock?
The top 20% of parts that cause 80% of failures; waiting on parts was a third of the repair time here.
How do I prove the fix?
Ten gated test shots after every repair before the mould returns to the line.
Why review weekly?
Trends need a regular beat; monthly reviews lose the detail and the owners.
What KPI should I watch?
Mould downtime as a share of available time, plus MTBF per mould; both moved together here.
Who owns the cards?
A named owner per mould; without an owner the system fades within a month.
What Would You Like to Solve?
Tell us your mould downtime share, fault history and spare situation, and we can work through the card system and review rhythm for your toolroom.