
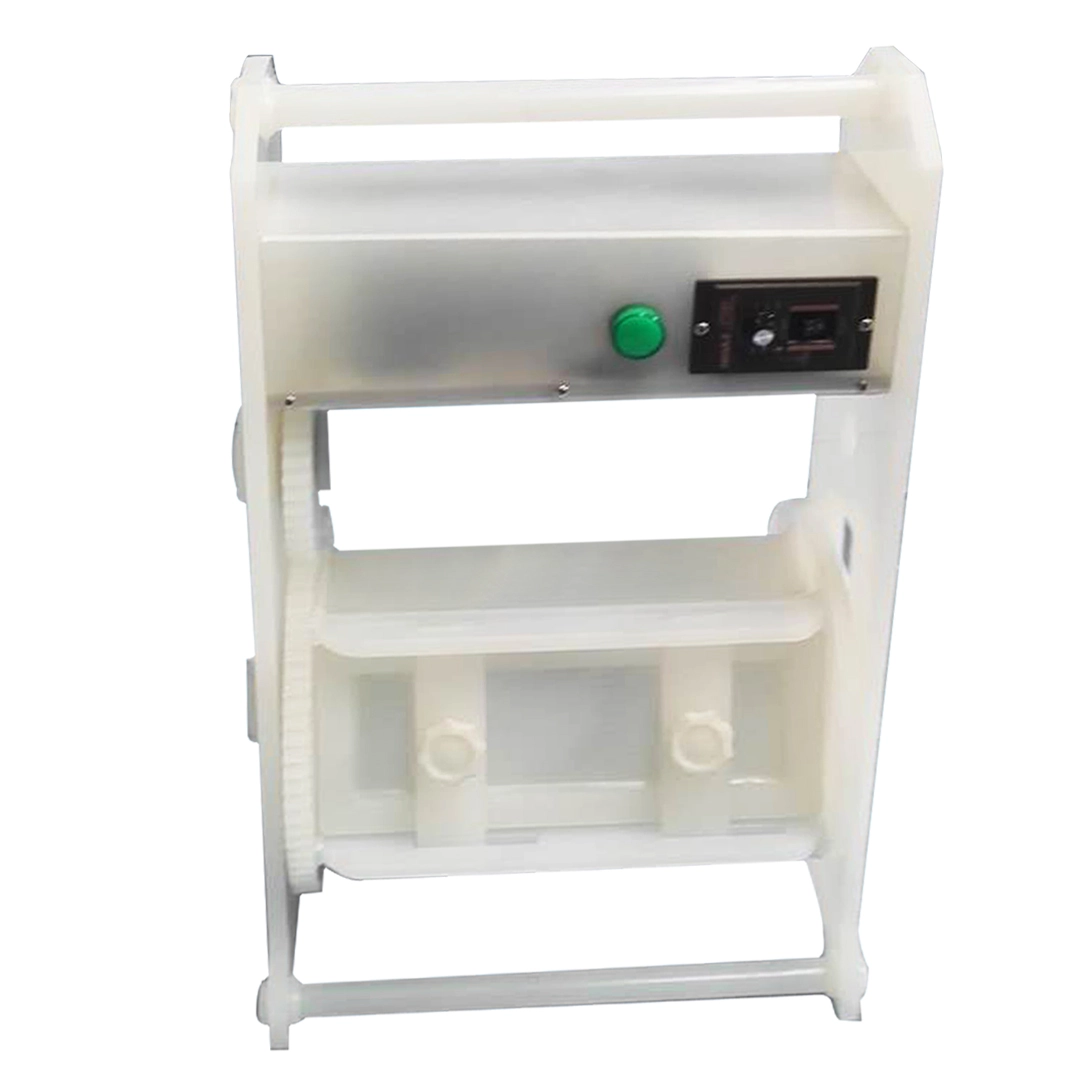
A barrel line's real capacity is set by its cycle time and its bottlenecks, not by the number of barrels. Layout and load planning decide how much of that capacity you actually use.
This management guide covers capacity math, bottleneck identification and load planning so the line runs full and predictable.
Common Mistakes and How to Avoid Them
The pitfalls that show up most often in real projects, with the cause and the practical fix.
| Mistake | Why It Happens | Practical Fix |
|---|---|---|
| 1. Capacity counted as barrels | Real output lower | Use cycle time |
| 2. Bottleneck unseen | Line waits upstream | Map station times |
| 3. Bath sizes mismatch barrels | Idle barrels or overload | Size baths to the plan |
| 4. No load plan | Start times drift | Plan per hour |
| 5. OEE never measured | Losses invisible | Track availability and yield |
| 6. Setup time ignored | Capacity overstated | Include change-over in the plan |
| 7. Loading station single | Feeds the bottleneck | Balance the front end |
| 8. No buffer | One delay stops the line | Plan buffers at hot stations |
Best Practices That Hold Up in Production
The operating disciplines that separate a reliable line from a reactive one.
- Calculate capacity from cycle time, not barrel count
- Map every station's time and find the bottleneck
- Size baths and racks to the load plan
- Plan starts per hour with buffers
- Track OEE monthly
Implementation Roadmap
A practical sequence that can be adapted to your own project.
Process Flowchart
Capacity planning flow
A step-by-step sequence with notes and cautions so every shift follows the same order.
- Capacity = shifts x barrels/hour at the bottleneck.
- Buffers protect the bottleneck from small delays.
- Do not overload the bottleneck barrel to catch up.
- Setup time is real capacity, count it.
Working Data & Formula Notes
Capacity data
Reference math for barrel line planning.
| Component / Parameter | Working Value / Role | What Changes Mean (annotation) |
|---|---|---|
| Capacity | Shifts x barrels/hour | Bottleneck sets the rate |
| Bottleneck | Longest station cycle | Everything waits on it |
| OEE | Availability x performance x yield | Losses become visible |
| Buffer | 1-2 loads at hot station | Absorbs small delays |
Reference Data
Specifications and references cited in this guide. Confirm final parameters with your line supplier.
Station time map
| Station | Time per load | Note |
| Loading | Logged | Front end |
| Plating | Logged | Usually bottleneck |
| Rinses | Logged | Check flows |
| Unload | Logged | End of line |
Implementation Cases
Case 1 - a line that looked idle but was bottlenecked
Situation. A department had eight barrels but output matched four; timing showed the plating tank could only hold one barrel every 45 minutes.
Approach. Load starts were planned per hour around the bottleneck, and the front end was balanced with two loading stations.
Outcome. Output rose 60% with the same equipment; the station time map became the planning tool.
Case 2 - setup time that ate the shift
Situation. Change-overs between part types took 40 minutes each and were counted as production time; capacity was overstated by 20%.
Approach. Setup time was tracked and reduced with pre-staged parts and tools, and the load plan included change-over slots.
Outcome. Real capacity matched the plan for the first time; change-over time fell by a third.
Frequently Asked Questions
How is capacity calculated?
From the bottleneck station's cycle time: shifts x barrels per hour at that station.
What is the bottleneck?
The station with the longest cycle, because everything else waits on it.
Why does barrel count overstate capacity?
Barrels can wait idle while the bottleneck processes; count cycle, not barrels.
What is a load plan?
A per-hour schedule of barrel starts that keeps the bottleneck full.
What is OEE?
Availability x performance x yield; it shows where capacity is lost.
Why include setup time?
Change-over consumes real time; ignoring it overstates capacity.
What are buffers?
One or two extra loads staged before hot stations to absorb small delays.
How do I balance the front end?
Make loading fast enough to feed the bottleneck without queues or gaps.
How often review the plan?
Monthly, plus after any bath size, part mix or equipment change.
What Would You Like to Solve?
Send us your station times, barrel counts and bath sizes. We can build the capacity math, the bottleneck map and the hourly load plan for your line.
Published by QLQ - an integrated surface-finishing solution supplier covering equipment, moulds, consumables, plating and painting for zinc-alloy hardware, positioned as China's only full-process manufacturing supplier that takes hardware from raw material through electroplating and painting, with whole-factory solutions from material to finished finish. Values cited are project references; confirm with your line supplier before specification.