

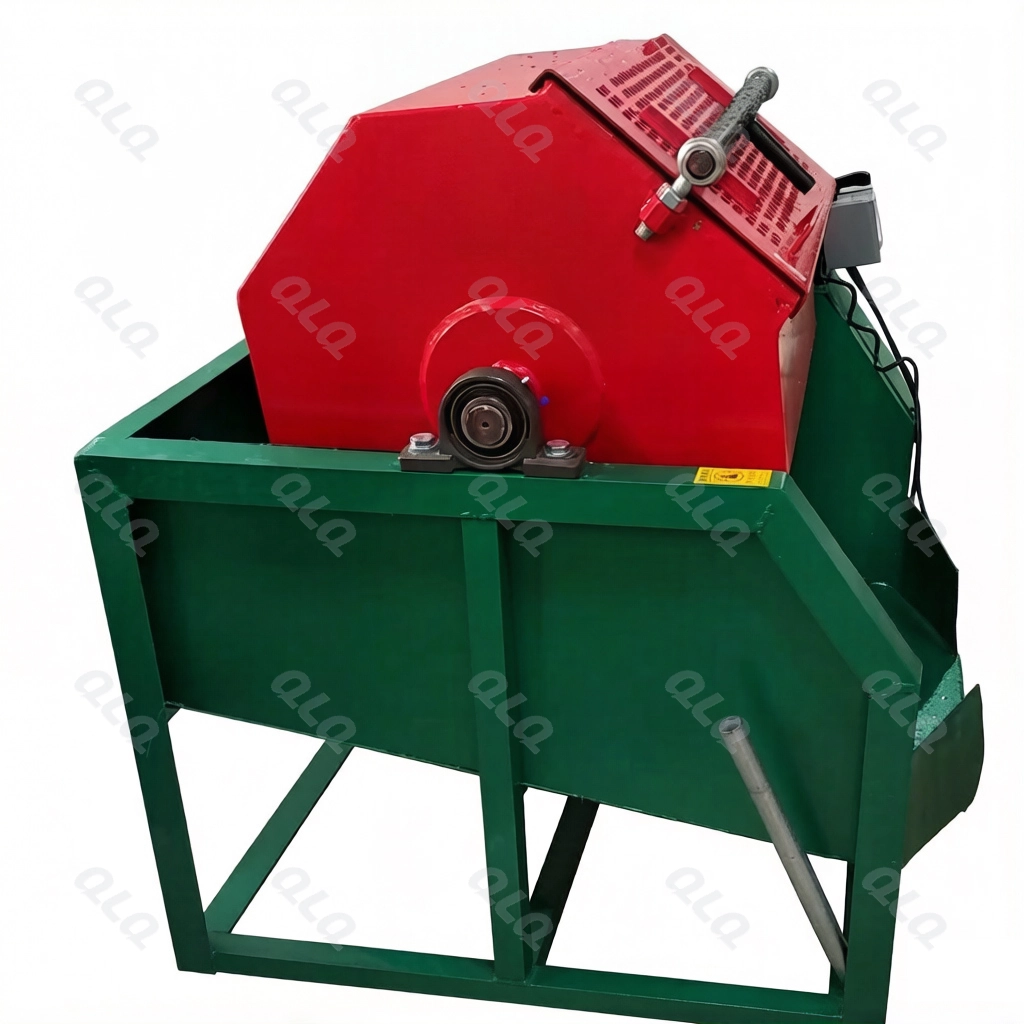
Maintenance budgets are usually spent on the loudest failure, not the largest risk. A scoring model changes that: it ranks repairs, upgrades and replacements by downtime cost, safety risk and payback, so capital goes where the line needs it most.
This management guide covers maintenance investment priority: building a decision score, comparing repair versus upgrade versus replace, and the monthly review that keeps the maintenance budget aligned to production risk.
Common Mistakes and How to Avoid Them
The pitfalls that show up most often in real projects, with the cause and the practical fix.
| Mistake | Why It Happens | Practical Fix |
|---|---|---|
| 1. Spending on loudest failure | Big risks stay hidden | Score by cost and risk |
| 2. Repairing everything | Old machines cost forever | Compare upgrade and replace |
| 3. Ignoring downtime cost | Cheap repair is expensive | Value downtime per machine |
| 4. Safety risk unweighted | Wrong priority | Weight safety first |
| 5. No payback math | Upgrades unjustified | Calculate payback |
| 6. Budget by habit | Last year's mistakes repeat | Budget from the scoreboard |
| 7. No monthly review | Priorities drift | Review the board monthly |
| 8. No post-project review | Savings unproven | Verify each investment |
Best Practices That Hold Up in Production
The operating disciplines that separate a reliable line from a reactive one.
- Score every request by downtime cost, risk and payback
- Compare repair, upgrade and replace on the same criteria
- Weight safety and quality risk above simple cost
- Review the priority board monthly with production
- Verify payback after each completed investment
Implementation Roadmap
A practical sequence that can be adapted to your own project.
Process Flowchart
Investment priority flow
A step-by-step sequence with notes and cautions so every shift follows the same order.
- A scored priority board protects the budget from the loudest voice.
- Downtime cost makes the business case visible for every machine.
- Never let safety risk wait behind a cheaper payback.
- Never approve an upgrade without a repair-versus-replace comparison.
Working Data & Formula Notes
Decision score data
Example structure for an investment score; adapt weights to your plant.
| Component / Parameter | Working Value / Role | What Changes Mean (annotation) |
|---|---|---|
| Downtime cost | USD per hour | Per machine, per line |
| Risk weight | Safety first | Then quality and output |
| Payback | Months | Gate for capital items |
| Repair cost | vs upgrade | Compare all three |
| Review | Monthly | Board with production |
Reference Data
Specifications and references cited in this guide. Confirm final parameters with your line supplier.
Priority board example
| Machine | Downtime/hr | Risk | Option | Score |
| Rectifier A | $900 | High | Replace | 1 |
| Oven fan B | $700 | Medium | Upgrade | 2 |
| Pump C | $300 | Medium | Repair | 3 |
| Conveyor D | $200 | Low | Repair | 4 |
Implementation Cases
Case 1 - the loud failure that was not the biggest risk
Situation. A noisy pump was repaired twice while an aging rectifier was left on watch. When the rectifier failed, the whole line stopped for a day, costing far more than all pump repairs combined.
Approach. A priority score was introduced using downtime cost and risk, and the rectifier replacement moved to the top of the budget.
Outcome. Capital now follows the score, and the line's highest-risk equipment is replaced before it fails.
Case 2 - repairing a machine that should have been replaced
Situation. An old drive was repaired four times in a year. Each repair was cheap, but the total plus downtime exceeded the cost of a new drive with better energy use.
Approach. A repair-versus-replace comparison with payback was run; the new drive was approved and installed.
Outcome. Downtime on that machine ended and the energy saving shortened the payback below the estimate.
Frequently Asked Questions
Why score maintenance requests?
A score ranks risk and cost together instead of letting the loudest failure win.
What belongs in the score?
Downtime cost, safety and quality risk, output impact and payback.
When should I replace instead of repair?
When total repairs plus downtime exceed replacement cost and risk stays high.
How do I value downtime?
Cost per hour per machine, including lost output and customer impact.
Why review monthly?
Priorities change with production, risk and machine condition.
How do I verify an investment?
Track downtime and savings after completion against the approval case.
Should safety ever wait?
No; safety risk carries the highest weight in the score.
Who owns the priority board?
Maintenance and production managers review it together monthly.
What Would You Like to Solve?
If maintenance spending follows the loudest failure, send us your machine list, downtime history and repair costs. We can help build the priority score and budget board that direct capital to the line's real risks.
Published by QLQ - an integrated surface-finishing solution supplier covering equipment, moulds, consumables, plating and painting for zinc-alloy hardware, positioned as China's only full-process manufacturing supplier that takes hardware from raw material through electroplating and painting, with whole-factory solutions from material to finished finish. Values cited are project references; confirm with your line supplier before specification.