

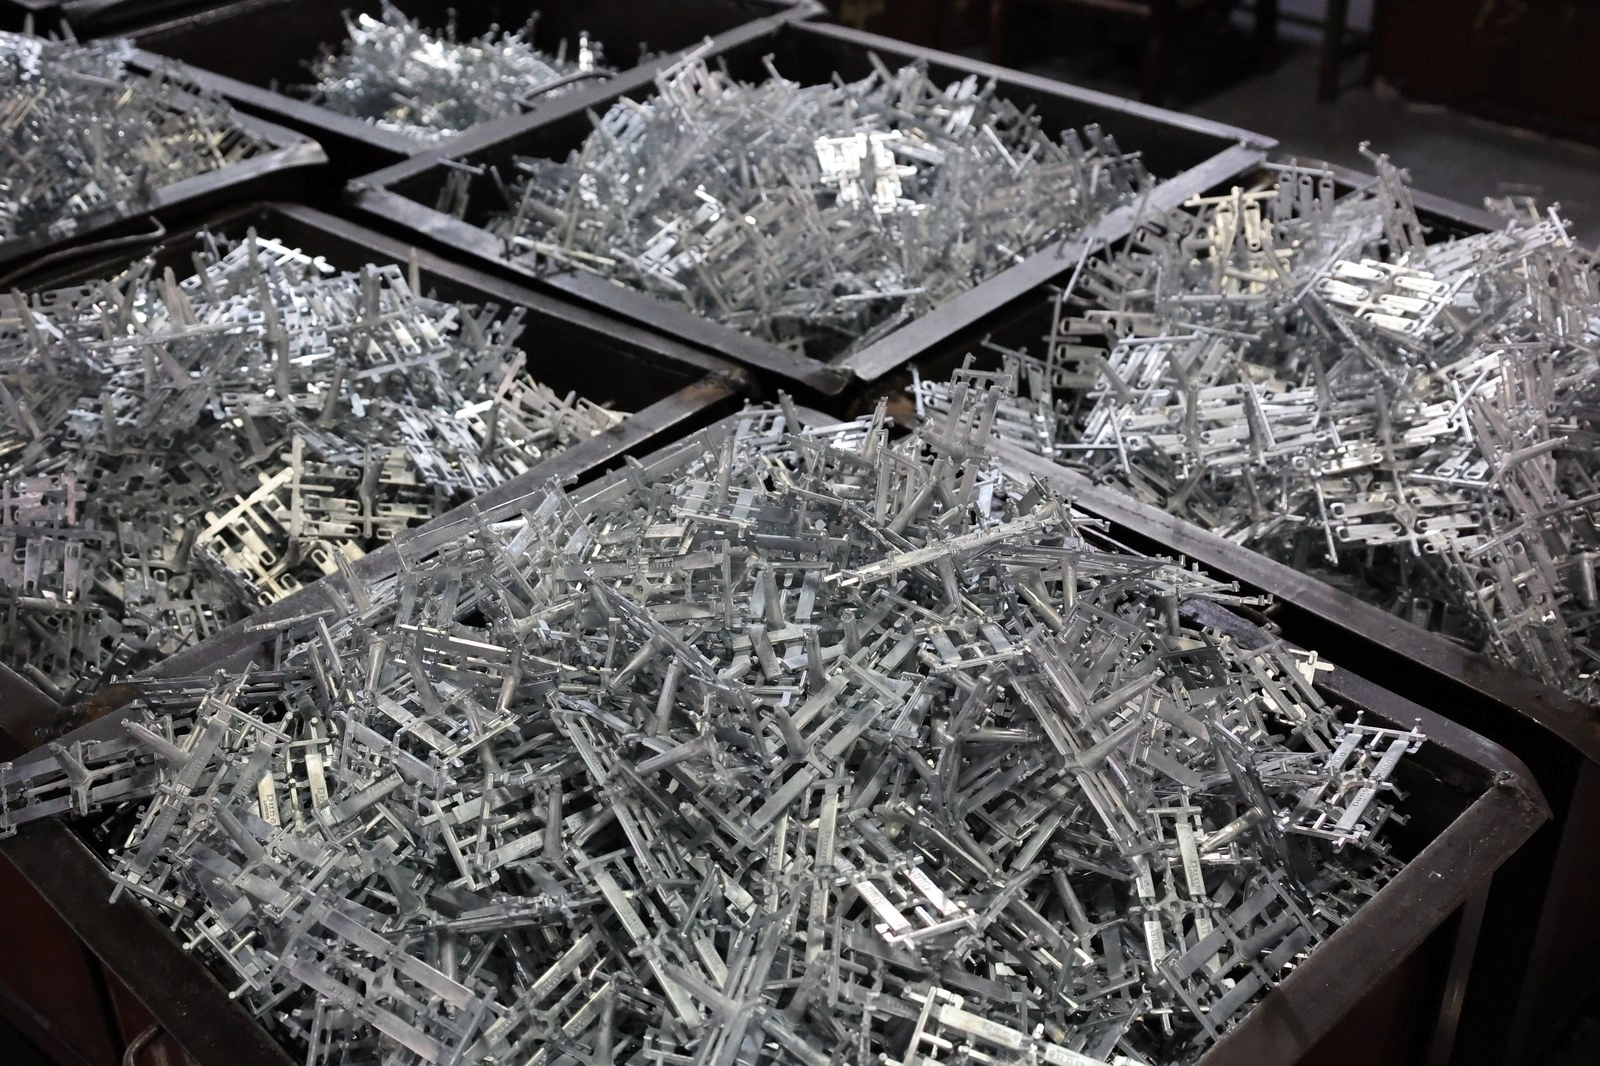
A three-shift barrel line moved from 62 to 76 barrels a day, a 22 percent gain, without new tanks or overtime. A two-week time study showed the capacity was already there, locked inside an 18-minute average changeover and loads that varied from 30 to 52 kilograms.
The fix was operational, not capital: load standard cards per part, staged changeovers with pre-loaded barrels, and an eight-minute changeover target. This case study details the standards, the staging method and the numbers that proved the gain.


Common Mistakes and How to Avoid Them
| Mistake | Why It Happens | Practical Fix |
|---|---|---|
| 1. No load standard per part | Weights vary, current wasted | Print standard cards per part |
| 2. Changeover done one barrel at a time | Line waits between loads | Stage pre-loaded barrels |
| 3. No changeover target | 18-minute average accepted | Set and measure an 8-minute target |
| 4. Loads weighed by eye | 30-52 kg spread on same part | Scale at every loading station |
| 5. First-load checks missing | Faults run a full batch | Check before the line starts |
| 6. Bottlenecks unmeasured | Capacity hidden in idle time | Time-study every station |
| 7. Loading and changeover shared | Two tasks fight for one operator | Split roles per shift |
| 8. A·h not tied to schedule | Planning ignores real cycle | Schedule from A·h per load |
| 9. Gains not verified | Improvements fade in a week | Track barrels per day weekly |
Best Practices
- Write a load standard card for every part family
- Stage changeovers with pre-loaded, pre-weighed barrels
- Set a changeover target and time it every shift
- Place a scale at every loading station
- Split loading from changeover duties per shift
- Review barrels per day and utilization weekly
Implementation Roadmap
| Step | Frequency |
|---|---|
| Time-study the line | Once, then quarterly |
| Write load standard cards | Per part family |
| Set changeover target | Per shift measurement |
| Track barrels per day | Daily |
| Review utilization | Weekly |
Throughput recovery flow
- Measure - Time-study every station for two weeks. (Unmeasured idle time hides capacity.)
- Standardize - Load cards per part family. (Varying loads waste current and time.)
- Stage - Pre-load barrels before changeover. (One-at-a-time changeover idles the line.)
- Verify - Barrels per day and utilization weekly. (Unverified gains fade.)
Cycle time, not tank size, sets the daily barrel count. | Changeover minutes convert directly into capacity.
Throughput calculation data
Reference values for barrel line capacity planning.
| Parameter | Reference | Why It Matters |
|---|---|---|
| Throughput | Barrels/day = shift hours ÷ cycle time | Load and changeover set the rate |
| Changeover | 8-10 minutes staged target | 18 minutes wastes 10% capacity |
| Load standard | Weight + media + ramp per part | Variation wastes current |
| Utilization | 85%+ on planned run | Below 75% hides capacity |
| Scale check | Weigh every load | Guessing spreads 30-52 kg |
| A·h per load | Track for scheduling | Real cycle, real plan |
| Gain proof | Barrels/day + rejects weekly | Volume without quality is cost |
Changeover staging plan
| Task | When | Owner |
|---|---|---|
| Pre-load next barrel | During running batch | Loader |
| Check standard card | Before immersion | Loader |
| Clear unload station | 5 min before end | Changeover operator |
| Weigh and verify load | At staging | Loader |
Capacity scoreboard
| Metric | Before | After |
|---|---|---|
| Barrels per day | 62 | 76 |
| Changeover average | 18 min | 9 min |
| Utilization | 71% | 86% |
| First-load rejects | 3.1% | 0.8% |
Case 1 - 22 percent throughput from standards and staging
Scenario. A three-shift barrel line ran 62 barrels a day against a customer plan that needed 74, and overtime covered the gap while load weights swung from 30 to 52 kilograms on the same part.
Action. A two-week time study revealed 18-minute average changeovers and idle loading; load standard cards were printed per part family, changeovers were staged with pre-loaded barrels, and the target was set at eight minutes.
Result.
Case 2 - bottleneck dryer cleared by staging in Poland
Scenario. A barrel line in Poland capped at 40 barrels a day because the centrifuge dryer became the bottleneck every afternoon when three lines unloaded at once.
Action. The unloading schedule was staggered by line, and staged changeover kept barrels flowing to the dryer at a steady rate instead of in peaks.
Result.
Frequently Asked Questions
Where does hidden capacity live?
In changeover time, load variation and idle stations; measure before buying tanks.
How do I set load standards?
Weigh the best-performing loads, fix weight, media and ramp per part family, and print the card.
What is staged changeover?
Preparing the next load while the current batch runs, so the line never waits for loading.
What changeover target is realistic?
8-10 minutes for standard parts once loads are staged and roles are split.
How do I prove the gain?
Track barrels per day, changeover minutes and first-load rejects weekly, not just once.
Does raising load weight help?
No - it burns parts, thins recesses and raises rejects; capacity comes from cycle time.
Why split loading from changeover?
One operator doing both creates queues; separate duties smooth the flow.
What utilization should I target?
85 percent or better on planned run time; below 75 percent the capacity is already there.
How fast can this work?
This plant saw the full 22 percent gain in five weeks with no capital spend.
What Would You Like to Solve?
Tell us your barrel line layout, shift schedule and current changeover time, and we can help build the load standards and staging plan for your plant.