
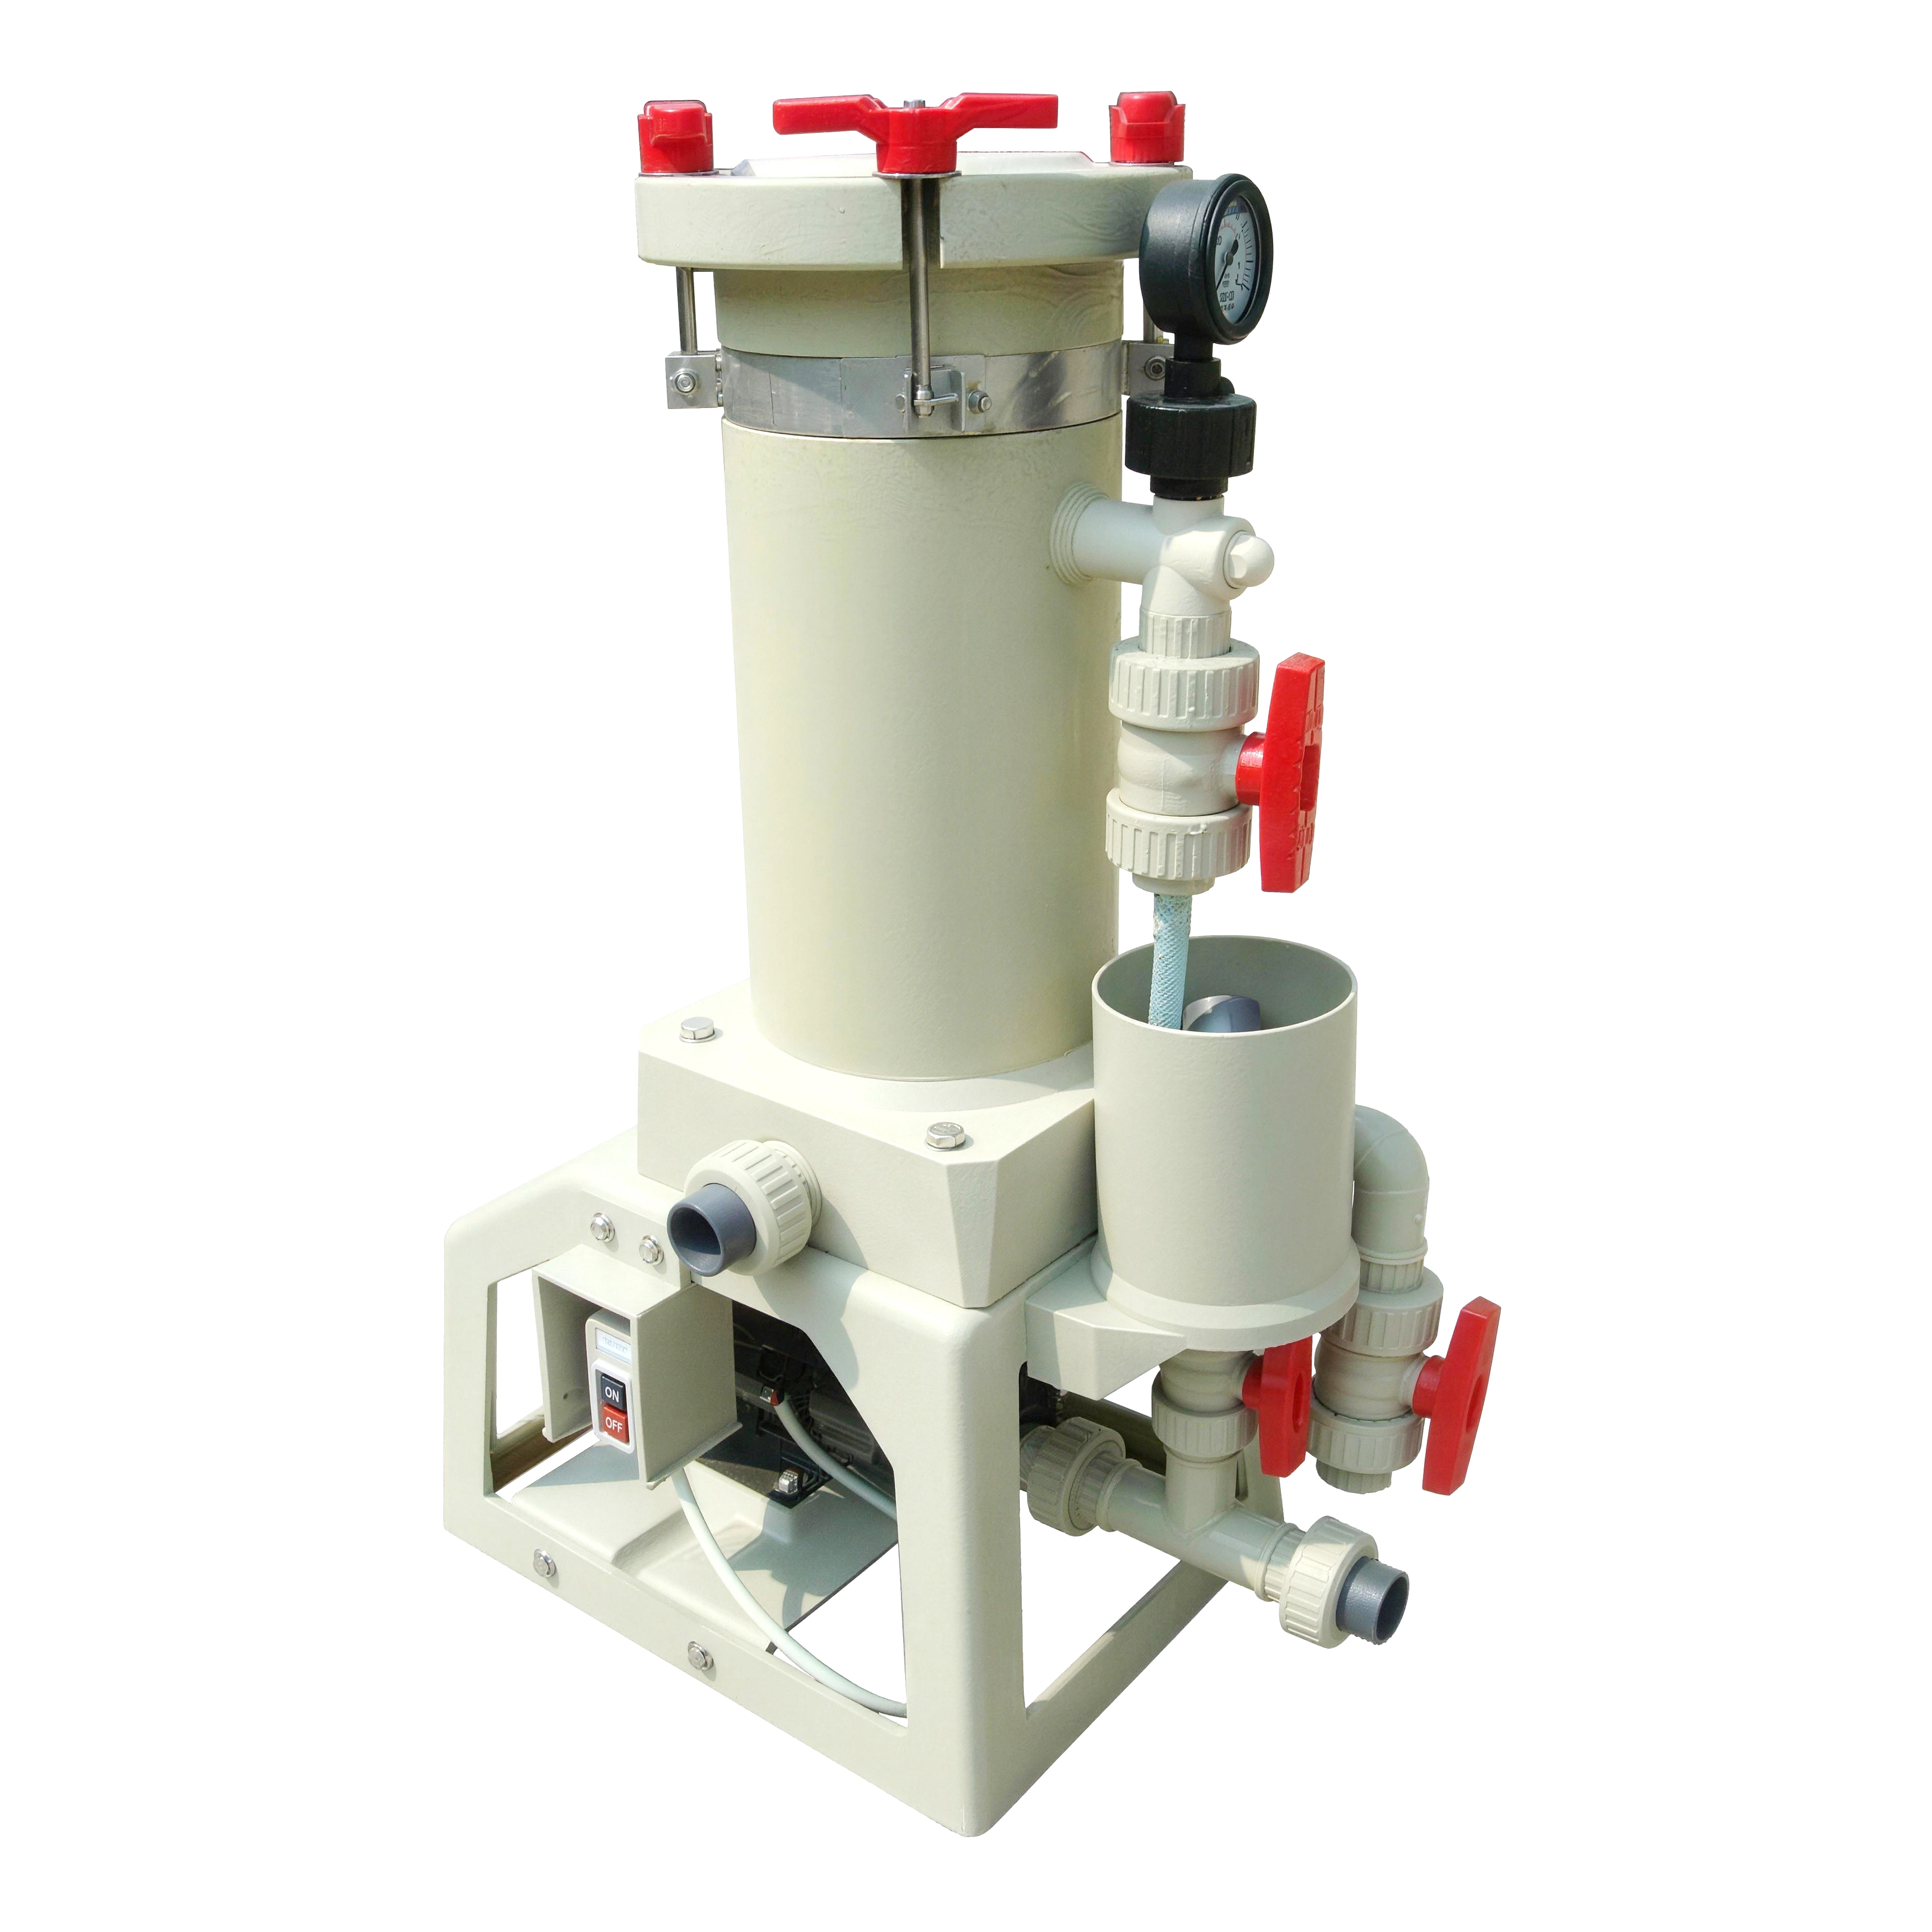
A reliability program turns maintenance from cost into uptime: OEE shows the loss, failure data shows the cause, and the improvement loop removes it.
This management guide covers the equipment reliability program for finishing lines.
Common Mistakes and How to Avoid Them
The pitfalls that show up most often in real projects, with the cause and the practical fix.
| Mistake | Why It Happens | Practical Fix |
|---|---|---|
| 1. OEE never measured | Loss invisible | Track it |
| 2. Failure data unlogged | Cause hidden | Log per stop |
| 3. Same failure repeated | Loop broken | Fix the cause |
| 4. Targets absent | Improvement unmeasurable | Set targets |
| 5. Maintenance blamed | Design cause | Use the data |
| 6. Loop not closed | Fixes forgotten | Verify and review |
| 7. OEE counted wrong | False picture | Count properly |
| 8. No review | Program decays | Monthly review |
Best Practices That Hold Up in Production
The operating disciplines that separate a reliable line from a reactive one.
- Track OEE per line
- Log every failure with cause
- Run the measure-fix-verify loop
- Set and review targets
- Review monthly
Implementation Roadmap
A practical sequence that can be adapted to your own project.
Process Flowchart
Reliability program flow
A step-by-step sequence with notes and cautions so every shift follows the same order.
- OEE is the program scoreboard.
- The loop removes losses one at a time.
- Count OEE correctly or the picture lies.
- Close every fix with verification.
Working Data & Formula Notes
Reliability data
Reference values for the reliability program.
| Component / Parameter | Working Value / Role | What Changes Mean (annotation) |
|---|---|---|
| OEE | Availability x performance x yield | Program scoreboard |
| Failures | Logged with cause | Data drives fixes |
| Loop | Measure, fix, verify | Losses removed |
| Review | Monthly | Program stays real |
Reference Data
Specifications and references cited in this guide. Confirm final parameters with your line supplier.
Monthly reliability card
| Line | OEE | Top loss | Fix | Target |
| Line 1 | Logged | Logged | Logged | Set |
| Line 2 | Logged | Logged | Logged | Set |
| Trend | Logged | Logged | Logged | - |
Implementation Cases
Case 1 - OEE that exposed the real loss
Situation. The line looked busy but OEE was 62%; failure data showed one pump caused half the downtime.
Approach. The pump was redesigned and the fix was verified in the monthly numbers.
Outcome. OEE rose to 78%; the data chose the fix.
Case 2 - a loop that was never closed
Situation. Fixes were made but never verified; the same failures returned month after month.
Approach. The measure-fix-verify loop was enforced and reviewed monthly.
Outcome. Failures stopped returning; the loop became the program.
Frequently Asked Questions
What is OEE?
Availability x performance x yield; the program scoreboard.
Why log failures?
Failure data with causes shows where to fix.
Why one cause at a time?
One fix, one verification, one number moved.
Why verify?
An unverified fix returns; the numbers prove it.
What targets?
OEE and downtime per line, set from data.
Why blame data, not people?
The data shows design and process causes.
Why review monthly?
The monthly review closes the loop.
How do I count OEE?
Per the standard: availability x performance x yield.
Who owns the program?
Maintenance management with production data.
What Would You Like to Solve?
Tell us your OEE data and top failures. We can help build the reliability card and the measure-fix-verify loop for your line.
Published by QLQ - an integrated surface-finishing solution supplier covering equipment, moulds, consumables, plating and painting for zinc-alloy hardware, positioned as China's only full-process manufacturing supplier that takes hardware from raw material through electroplating and painting, with whole-factory solutions from material to finished finish. Values cited are project references; confirm with your line supplier before specification.