

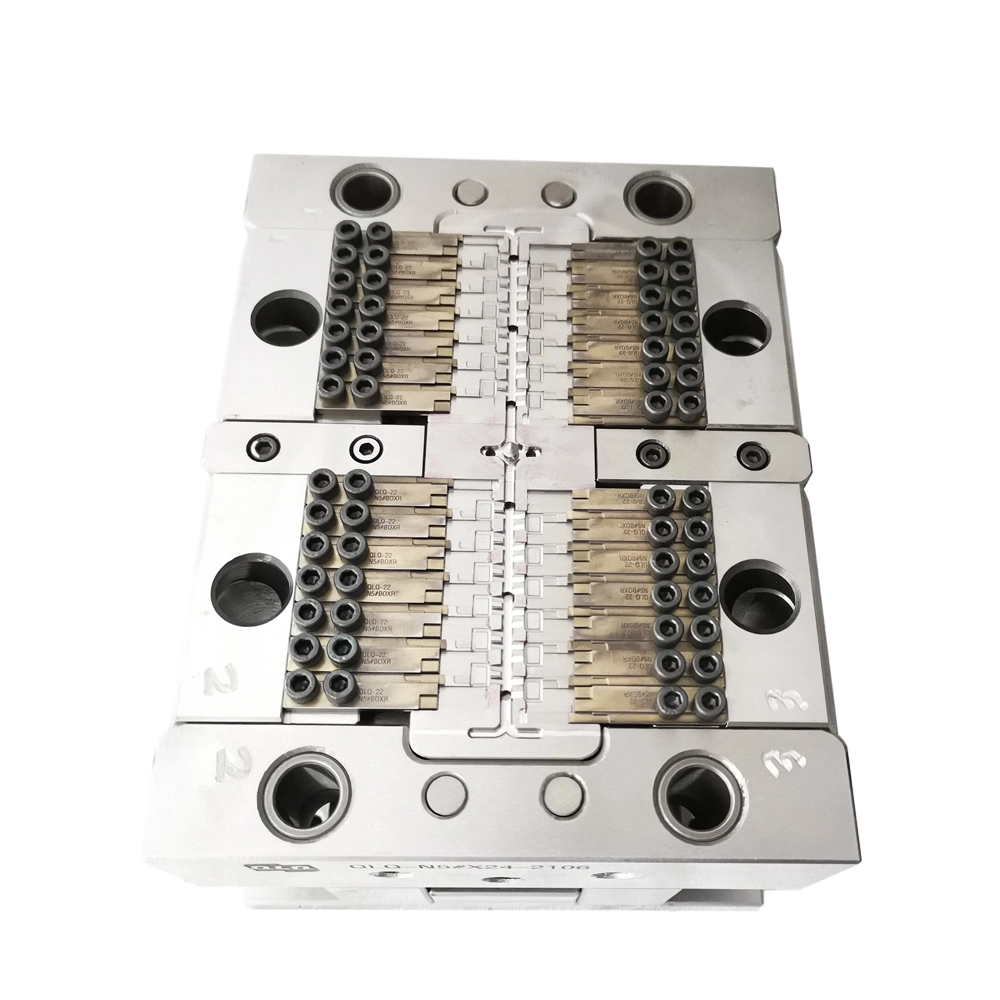
Energy and scrap are the two quiet costs of a die-casting department. A manager who tracks kWh per kg and scrap per thousand parts finds savings that no machine card can show.
This management guide covers the energy and scrap cost review: meters, melt loss, allocation and the weekly numbers meeting that turns data into savings.
Common Mistakes and How to Avoid Them
The pitfalls that show up most often in real projects, with the cause and the practical fix.
| Mistake | Why It Happens | Practical Fix |
|---|---|---|
| 1. Energy unmetered | Cost invisible | Fit meters per line |
| 2. Melt loss guessed | Metal cost hidden | Weigh metal in and out |
| 3. Scrap not counted | Loss disguised | Count per 1000 parts |
| 4. All costs averaged | Waste hidden | Allocate per machine |
| 5. Review skipped | Trends missed | Fixed weekly slot |
| 6. Fixing without data | Wrong target | Pareto first |
| 7. Off-peak ignored | Energy cost high | Plan melts off-peak |
| 8. No target | Improvement unmeasurable | Set per line |
Best Practices That Hold Up in Production
The operating disciplines that separate a reliable line from a reactive one.
- Meter energy per line
- Weigh metal in and out for melt loss
- Count scrap per thousand parts
- Allocate cost per machine
- Hold a weekly numbers meeting
Implementation Roadmap
A practical sequence that can be adapted to your own project.
Process Flowchart
Cost review flow
A step-by-step sequence with notes and cautions so every shift follows the same order.
- kWh per kg shows machine and shift differences.
- Scrap per 1000 turns defects into money.
- Weigh metal honestly - melt loss hides in dross.
- Do not average costs across machines.
Working Data & Formula Notes
Cost review data
Reference values for energy and scrap review.
| Component / Parameter | Working Value / Role | What Changes Mean (annotation) |
|---|---|---|
| Energy | kWh per kg parts | Shift and machine differences |
| Melt loss | Metal in vs parts out | Dross and spills |
| Scrap | Per 1000 parts | Top defect is the fix |
| Allocation | Per machine | Averaging hides waste |
Reference Data
Specifications and references cited in this guide. Confirm final parameters with your line supplier.
Weekly cost card
| Line | kWh/kg | Melt loss % | Scrap/1000 | Cost/part |
| Line 1 | Logged | Logged | Logged | Logged |
| Line 2 | Logged | Logged | Logged | Logged |
| Target | Set | Set | Set | Set |
Implementation Cases
Case 1 - kWh per kg that exposed a shift gap
Situation. Energy looked flat until kWh per kg was split by shift; the night shift used 18% more per kg with the same parts.
Approach. The night process was reviewed and a pre-heat/light-load habit was corrected.
Outcome. Energy per kg fell to the day-shift level; the weekly card made it visible.
Case 2 - melt loss found by honest weighing
Situation. Melt loss was assumed at 3% but weighing showed 6% because dross was over-skimmed and spills were not recovered.
Approach. Skimming practice was corrected and spill recovery trays were added.
Outcome. Melt loss returned below 4%; the scale became the gate.
Frequently Asked Questions
Why kWh per kg?
It normalizes energy for production and shows machine and shift differences.
How do I measure melt loss?
Weigh metal in and finished parts out over a period; the gap is loss.
Why scrap per 1000 parts?
It turns defects into a comparable money number across lines.
Why allocate cost per machine?
Averaging hides the wasteful machine or shift.
What is the weekly numbers meeting?
A fixed slot reviewing energy, melt loss, scrap and cost per part with actions.
Why Pareto first?
Fixing the top loss first gives the fastest saving.
Can I run melts off-peak?
Where tariffs differ, yes - planning melts off-peak cuts energy cost.
What targets should I set?
kWh per kg, melt loss and scrap per 1000 per line, from real data.
What Would You Like to Solve?
Send us your energy bills, metal weights and scrap data. We can build the kWh per kg card, melt-loss log and the weekly numbers meeting for your department.
Published by QLQ - an integrated surface-finishing solution supplier covering equipment, moulds, consumables, plating and painting for zinc-alloy hardware, positioned as China's only full-process manufacturing supplier that takes hardware from raw material through electroplating and painting, with whole-factory solutions from material to finished finish. Values cited are project references; confirm with your line supplier before specification.