

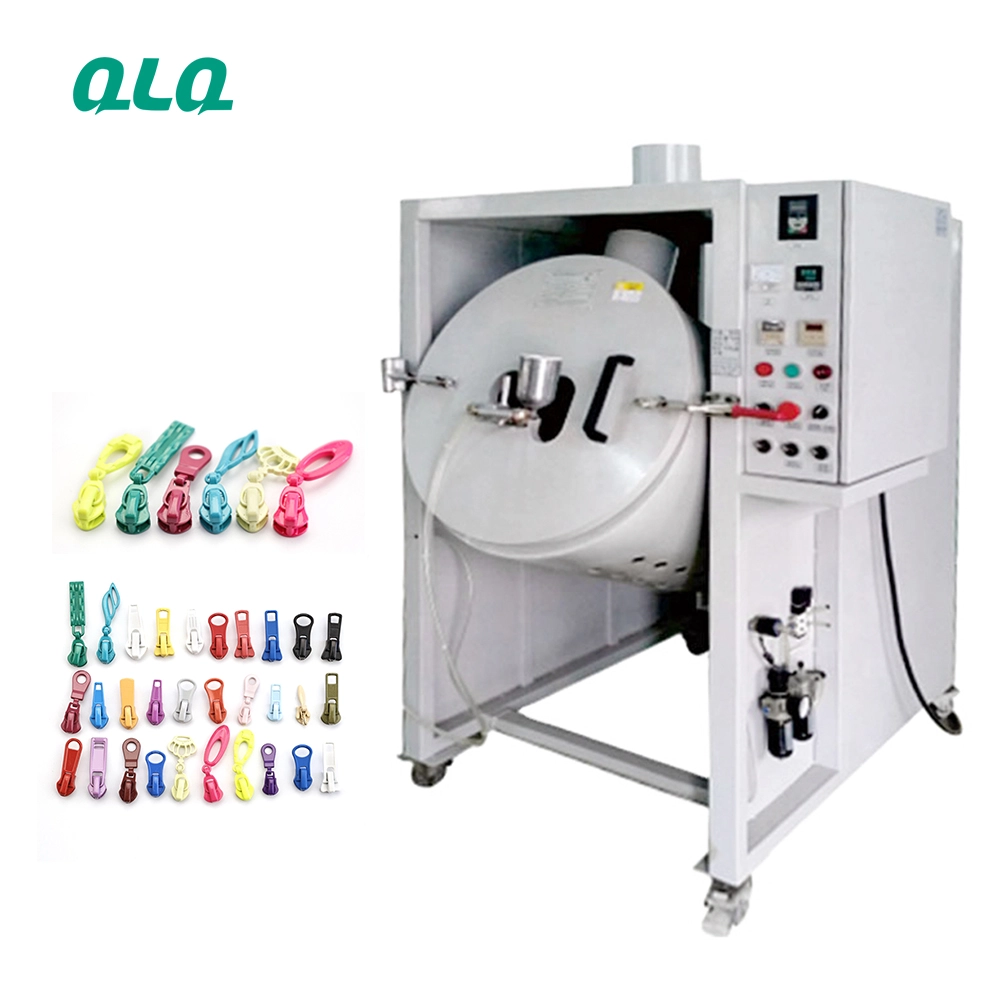
A tumble painting department that tracks only yield cannot see whether money is lost in paint, solvent, media or energy. Cost per batch brings every consumption into one scoreboard, so the cheapest-looking batch may turn out to be the most expensive.
This management guide shows how to build a cost-per-batch scoreboard: metering paint and solvent use, tracking media life, reading energy per batch, and using the weekly board to set improvement targets.
Common Mistakes and How to Avoid Them
The pitfalls that show up most often in real projects, with the cause and the practical fix.
| Mistake | Why It Happens | Practical Fix |
|---|---|---|
| 1. Tracking only paint litres | Solvent and energy hide losses | Track full batch cost |
| 2. Estimating usage | Losses invisible until month end | Meter paint and solvent |
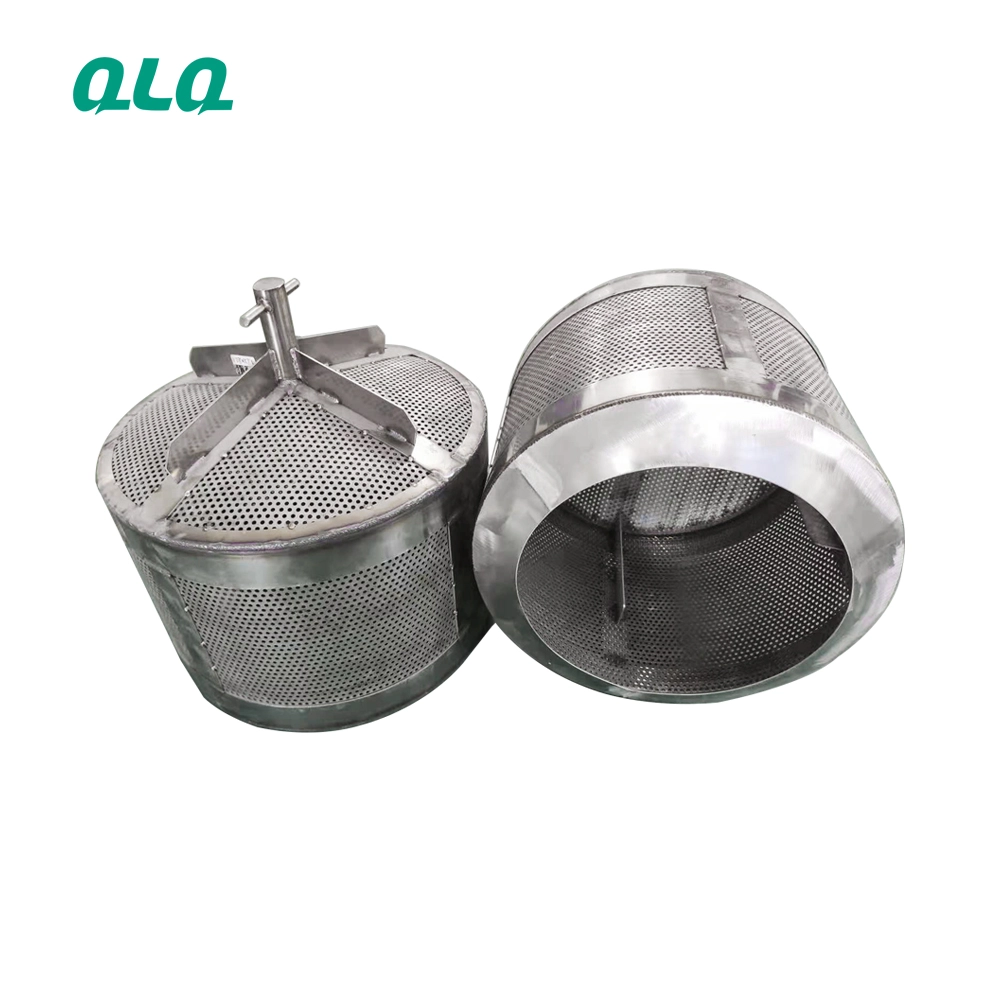
| 3. No media life log | Media replaced too early or late | Track batches per media set |
| 4. Oven run half empty | Energy cost per part doubles | Consolidate oven loads |
| 5. Spray over-run | Paint wasted on windows | Tune spray time per recipe |
| 6. No weekly review | Cost drift becomes normal | Review the scoreboard weekly |
| 7. Comparing batches by look | Cheap batch can be false economy | Compare full cost |
| 8. Improvement without data | Change is unmeasurable | Set targets from the scoreboard |
Best Practices That Hold Up in Production
The operating disciplines that separate a reliable line from a reactive one.
- Measure paint and solvent per batch, not by estimate
- Track media life in batches per set
- Consolidate oven loads to protect energy cost
- Review full cost per batch weekly
- Set improvement targets from scoreboard data
Implementation Roadmap
A practical sequence that can be adapted to your own project.
Process Flowchart
Cost scoreboard flow
A step-by-step sequence with notes and cautions so every shift follows the same order.
- Cost per batch makes waste visible while it can still be corrected.
- The scoreboard is an improvement tool, not a blame tool.
- Never compare batches of different sizes on cost alone; use cost per part.
- Never set an energy target that breaks the cure window.
Working Data & Formula Notes
Cost board data
Example calculation units for a cost-per-batch board; adapt to your prices.
| Component / Parameter | Working Value / Role | What Changes Mean (annotation) |
|---|---|---|
| Paint cost | Litres x price | Measured per batch |
| Solvent cost | Litres x price | Including clean-outs |
| Media cost | Set price / batches per set | Spread across life |
| Energy cost | kWh per oven cycle | Consolidate full loads |
| Total | Sum per batch | Report per part as well |
Reference Data
Specifications and references cited in this guide. Confirm final parameters with your line supplier.
Weekly cost board example
| Batch type | Paint | Solvent | Media | Energy | Total per 1000 parts |
| Light sliders | $8 | $2 | $1 | $3 | $14 |
| Medium buckles | $11 | $3 | $2 | $4 | $20 |
| Heavy D-rings | $14 | $4 | $2 | $5 | $25 |
| Fine springs | $6 | $2 | $1 | $2 | $11 |
Implementation Cases
Case 1 - the expensive cheap batch
Situation. One batch type looked cheap on paint, but a monthly review of full cost showed its oven was often run half empty and solvent use was double the standard for clean-outs.
Approach. The board added solvent and energy lines; batch types were consolidated into fuller oven loads and clean-out rules were standardized.
Outcome. Cost per thousand parts for that type fell by 22% within two months.
Case 2 - spray over-run on a high-volume batch
Situation. Paint usage on a popular slider batch was 30% above the recipe card. The team assumed the card was wrong until the board showed the same batch type had met the card six months earlier.
Approach. A review found spray windows running longer than the card after a control change; timing was reset and verified.
Outcome. Paint use returned to the card level and the department saved its largest single paint cost line.
Frequently Asked Questions
What belongs on a batch cost board?
Paint, solvent, media, energy and labour, compared per batch and per part.
Why not track only paint?
Solvent and energy can hide the largest waste in a tumble department.
How do I measure paint use?
Meter litres per batch on the batch card, not a monthly estimate.
How do I cost media?
Divide the media set price by the number of batches it serves.
Why consolidate oven loads?
A half-full oven costs the same energy for fewer parts.
How often should I review?
Weekly with the shift leaders against the same batch types.
What if a batch looks cheap but costs more?
Compare full cost per part; that is the number that matters.
How do I set improvement targets?
One target at a time, measured from the scoreboard baseline.
What Would You Like to Solve?
If tumble painting costs are split across too many ledgers to see, send us your batch types, usage records and utility rates. We can help design the cost-per-batch board and weekly review format that surfaces waste early.
Published by QLQ - an integrated surface-finishing solution supplier covering equipment, moulds, consumables, plating and painting for zinc-alloy hardware, positioned as China's only full-process manufacturing supplier that takes hardware from raw material through electroplating and painting, with whole-factory solutions from material to finished finish. Values cited are project references; confirm with your line supplier before specification.