

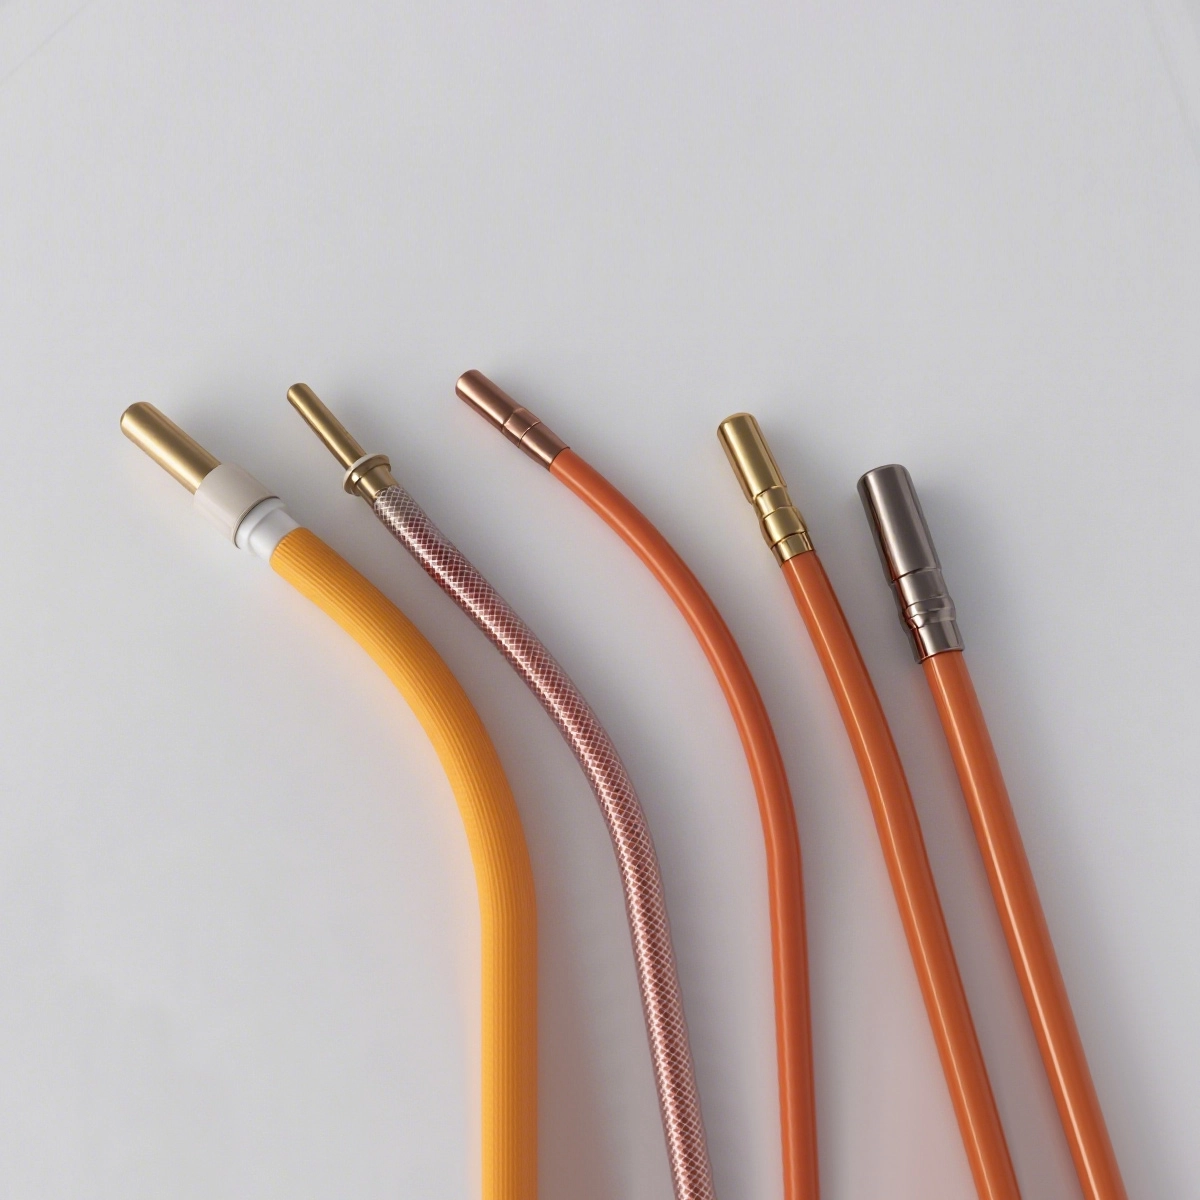
Chemistry spend is one of the largest variable costs on a plating line, yet many departments buy additives by supplier habit and discover overspend at month end. A consumption budget changes that: it predicts what each line should use, ties purchasing to ampere-hours, and shows waste in time to correct it.
This management guide covers chemistry cost control: consumption baselines per line, additive budgets linked to production, inventory rules, and the cost-per-square-metre review that makes chemistry visible.
Common Mistakes and How to Avoid Them
The pitfalls that show up most often in real projects, with the cause and the practical fix.
| Mistake | Why It Happens | Practical Fix |
|---|---|---|
| 1. Buying by habit | Stock builds and cash sits | Budget from consumption data |
| 2. No per-line baseline | Cannot see which line wastes | Measure consumption per line |
| 3. Variance ignored | Waste becomes normal | Review any variance over 10% |
| 4. Inventory hoarding | Expired chemicals and cash | Set weeks of cover per chemical |
| 5. Cost hidden in general spend | No visibility for action | Report cost per square metre |
| 6. One supplier with no KPI | Price drifts without review | Review supplier performance quarterly |
| 7. No waste tracking | Losses invisible in budget | Log spills, over-dosing and dumps |
| 8. Budget never reviewed | Plan decays with time | Review monthly with production |
Best Practices That Hold Up in Production
The operating disciplines that separate a reliable line from a reactive one.
- Build consumption baselines from real line data
- Link additive budgets to A-hr or square metres
- Set inventory cover weeks and review stock monthly
- Track chemistry cost per square metre plated
- Review supplier performance and variance quarterly
Implementation Roadmap
A practical sequence that can be adapted to your own project.
Process Flowchart
Chemistry budget flow
A step-by-step sequence with notes and cautions so every shift follows the same order.
- Chemistry budget is a control tool, not a punishment.
- Per-line consumption turns waste into a conversation with evidence.
- Never let one line's overuse hide in a plant-wide average.
- Never set stock levels without consumption data.
Working Data & Formula Notes
Budget data
Example values for building a chemistry budget; replace with your own consumption.
| Component / Parameter | Working Value / Role | What Changes Mean (annotation) |
|---|---|---|
| Budget base | A-hr or m2 plated | The fairest driver of chemical use |
| Consumption | g or mL per unit | Measured from line history |
| Inventory | 2-4 weeks cover | Balances risk and cash |
| Variance gate | 10% | Above this, review dosing and waste |
| Cost metric | Per square metre | Makes chemistry comparable across lines |
Reference Data
Specifications and references cited in this guide. Confirm final parameters with your line supplier.
Chemistry review board
| Line | Budget vs actual | Variance | Action |
| Barrel line A | 98% | Low | Continue |
| Rack line B | 118% | High | Audit dosing and drag-out |
| Strike line C | 107% | Medium | Check tank loss |
| Plant total | 104% | Medium | Monthly review |
Implementation Cases
Case 1 - the line that used twice its budget
Situation. A rack line consumed brightener at nearly double the rate of an identical line. Month-end reports showed the overspend, but nobody had tracked it by line during the month.
Approach. Consumption baselines were built per line, linked to A-hr, and reviewed weekly. The audit found dosing errors and an oversized drag-out loss.
Outcome. The line's consumption returned to budget within six weeks and the plant saved a full month of additive cost per year.
Case 2 - stock that aged on the shelf
Situation. A department bought chemicals in bulk on habit. A stock check found batches past their shelf life and cash tied up in slow-moving additives.
Approach. Inventory rules were set at four weeks of cover with reorder points from consumption data, and the bulk habit was replaced by planned deliveries.
Outcome. Expired stock stopped, storage space freed up, and chemistry cost per square metre dropped in the next quarter.
Frequently Asked Questions
How should chemistry budget be set?
From measured consumption per line, linked to production units such as A-hr or square metres.
What is a healthy variance?
Around 10%; above that, review dosing, drag-out and waste.
How much stock should I hold?
Typically two to four weeks of cover based on consumption, not habit.
What cost metric works best?
Cost per square metre plated makes lines and periods comparable.
Why track by line?
Plant-wide averages hide the line that is wasting chemistry.
How often should I review?
Monthly against budget, with supplier performance reviewed quarterly.
How do I find waste?
Log spills, over-dosing, drag-out losses and dumps as part of normal records.
Who owns the chemistry budget?
One department owner who reviews consumption with the shift leaders.
What Would You Like to Solve?
If chemistry spend is invisible or drifting, send us your consumption history, A-hr data and stock list. We can help build the per-line budget, inventory rules and cost-per-square-metre review board.
Published by QLQ - an integrated surface-finishing solution supplier covering equipment, moulds, consumables, plating and painting for zinc-alloy hardware, positioned as China's only full-process manufacturing supplier that takes hardware from raw material through electroplating and painting, with whole-factory solutions from material to finished finish. Values cited are project references; confirm with your line supplier before specification.