

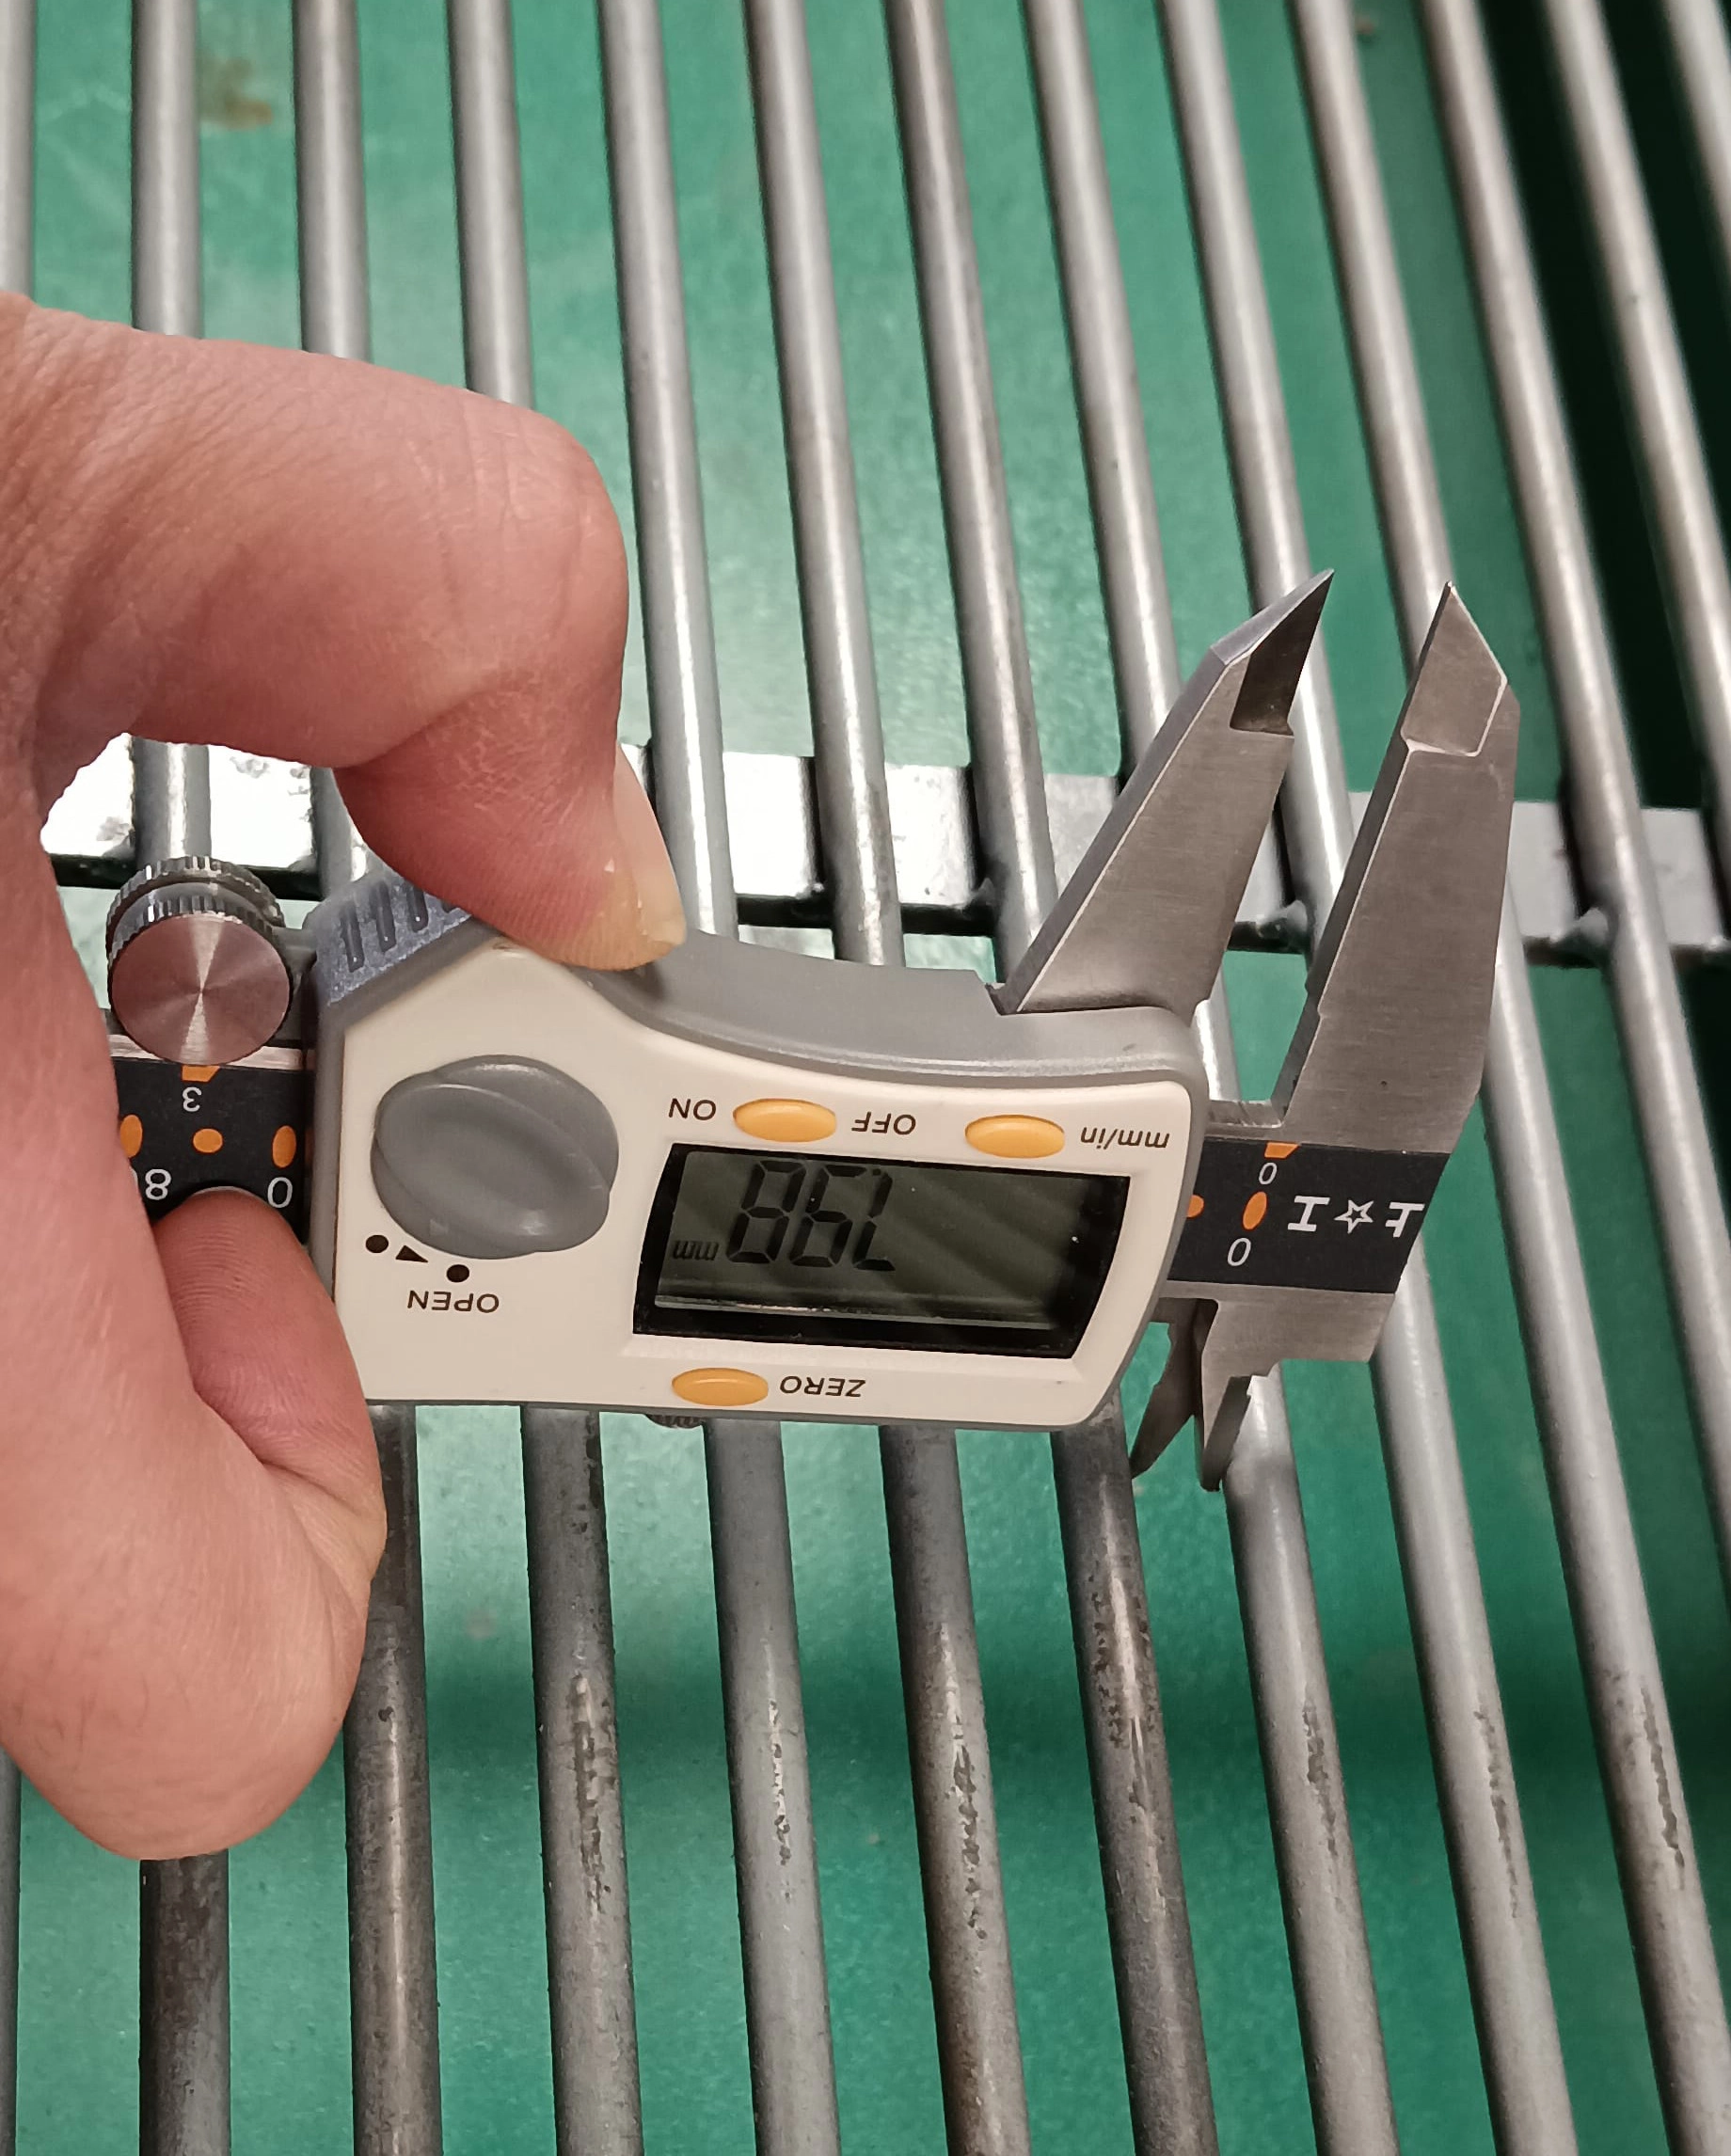
Building the Monthly Quality Cost Report: Where Every Number Comes From — 月度质量成本报告构建:每个数字的来源与口径.
This is a working reference, not theory: every table and checklist here is designed to be printed and used at the line. It complements the failure case studies published in the Technician Hub with the standard documents those cases eventually produced.
Common Mistakes and How to Avoid Them
| Mistake | Why It Happens | Practical Fix |
|---|---|---|
| 1. Calibrating monthly only | Drift between calibrations corrupts data | Foil-check at shift start |
| 2. Recording pass/fail only | No raw data means no trend analysis | Record microns; analyse weekly |
Best Practices
- Raw-value entry sheets at every station
- Weekly trend review with production
- Marked measurement point maps per part
Daily Measurement Sequence
- Foil calibration - Standard foils, 3 readings (Skip = all data suspect)
- Measure mapped points - 3 per part minimum (Random points hide failures)
- Enter raw values - Microns, not pass/fail (Trends need numbers)
Sheets at every station | Weekly trend review meeting
Measurement Discipline Reference
Practical points for thickness and quality data collection.
| Parameter | Reference | Why It Matters |
|---|---|---|
| Foil calibration | Every shift start | Catches drift before bad data spreads |
| Measure points | 3 per part, mapped | Random points hide real coverage problems |
| Raw values recorded | Always in microns | Pass/fail records destroy trend analysis |
| Report retention | ≥24 months | Customer disputes reach back years |
Raw data won a dispute
Scenario. A customer challenged thickness results with no historical basis to answer.
Action. Twelve months of raw micron readings with mapped points were presented.
Result. The challenge closed; the same data later defended two more lots.
Frequently Asked Questions
We calibrate monthly — why daily foil checks?
Between-month drift corrupts every reading in between. A two-minute foil check at shift start protects all data.
Why record raw values when we only need pass/fail?
Trend analysis needs numbers. Pass/fail records hide the drift that predicts next month's failures.
How many points per part?
Three minimum, marked on a point map. Random points hide exactly the failures customers find.
Implementation Roadmap
| Step | Frequency |
|---|---|
| Foil calibration at shift start | Every shift |
| Raw-value sheets at stations | Day 1 |
| Monthly cost report first issue | Month 1 |
What Would You Like to Solve?
If you would like this checklist or template adapted to your own line and part mix, contact QLQ — we supply the full equipment and chemistry package along with the working documents that make it run.