
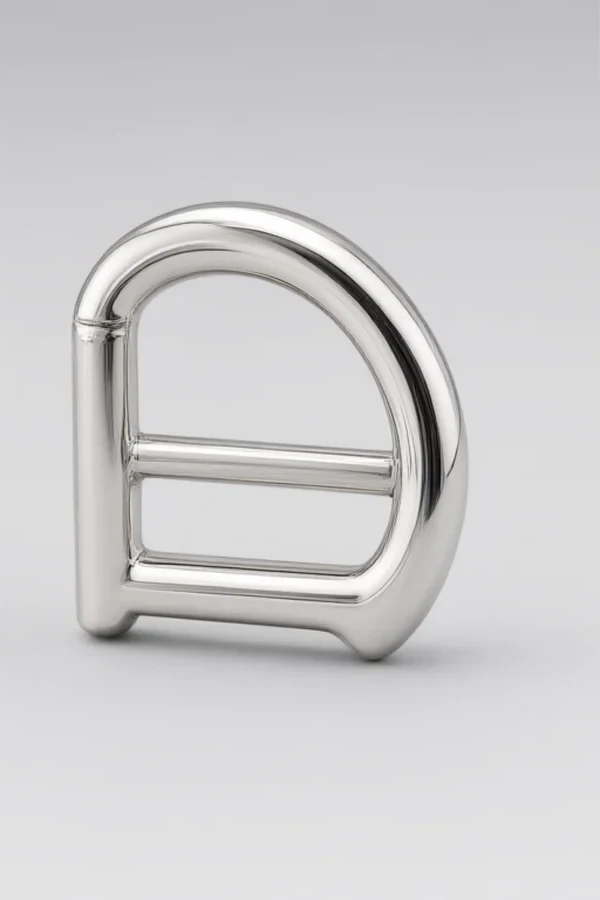
Every rack carries solution out of the tank. Drag-out is the silent cost of pre-treatment: chemistry lost, rinses loaded, and effluent charged.
This intermediate guide shows how to measure drag-out, reduce it with rack geometry and drain time, and recover it so the savings are real.
Common Mistakes and How to Avoid Them
The pitfalls that show up most often in real projects, with the cause and the practical fix.
| Mistake | Why It Happens | Practical Fix |
|---|---|---|
| 1. Racks drained in air | Chemistry lost, rinse loaded | Drain over the source tank |
| 2. Drain time too short | Drag-out doubles | Hold 10-30 seconds |
| 3. Cup-shaped parts | Solution pockets | Tilt the rack or add drain holes |
| 4. No drip boards | Chemistry runs to the floor | Fit drip boards and route back |
| 5. Recovery tank never used | Savings left on the table | Rinse-back into the tank |
| 6. Drag-out never measured | Cost invisible | Weigh or measure once a month |
| 7. Rinse overflow too high | Dilution hides recovery | Balance recovery vs overflow |
| 8. No drain time posted | Each operator differs | Post seconds per station |
Best Practices That Hold Up in Production
The operating disciplines that separate a reliable line from a reactive one.
- Drain every rack over its source tank
- Hold 10-30 seconds drain time
- Tilt racks so cup shapes empty
- Fit drip boards routed back to the tank
- Measure drag-out monthly
Implementation Roadmap
A practical sequence that can be adapted to your own project.
Process Flowchart
Drag-out control flow
A step-by-step sequence with notes and cautions so every shift follows the same order.
- Drag-out film on parts is roughly 0.1-0.3 mm thick.
- Drain time is free; recovery pays for itself.
- Drip boards must route back, not to the drain.
- Rinse-back needs level control on the tank.
Working Data & Formula Notes
Drag-out data
Reference values for estimating drag-out.
| Component / Parameter | Working Value / Role | What Changes Mean (annotation) |
|---|---|---|
| Drag-out film | 0.1-0.3 mm | Multiplies by surface area |
| Drain time | 10-30 seconds | Below, film doubles |
| Recovery | Rinse-back to tank | Returns chemistry to the bath |
| Review | Monthly | Trend proves the fix |
Reference Data
Specifications and references cited in this guide. Confirm final parameters with your line supplier.
Drain time by part shape
| Shape | Drain time | Extra action |
| Flat frames | 10-15 s | None |
| Cups / recesses | 20-30 s | Tilt the rack |
| Blind holes | 20-30 s + tap | Drain holes or second tap |
Implementation Cases
Case 1 - air-drained racks costing chemistry
Situation. A plant estimated drag-out by weight and found 30% of degreaser was leaving the tank on racks drained in the air.
Approach. Racks were re-routed to drain over the source tank for 20 seconds, and drip boards were fitted with return piping.
Outcome. Degreaser top-up fell by a quarter and the final rinse conductivity dropped.
Case 2 - cup-shaped parts that pocketed solution
Situation. Slider caps with cup shapes carried a visible puddle into the rinse; nickel showed drag-in contamination on Mondays.
Approach. Racks were tilted, drain time was set to 30 seconds for cups, and a rinse-back tank was added for the cleaner.
Outcome. The puddles disappeared and Monday contamination stopped; the recovery tank paid for itself within a quarter.
Frequently Asked Questions
What is drag-out?
The film of solution that clings to parts and racks leaving a tank.
How much solution is dragged out?
Roughly a 0.1-0.3 mm film, which multiplies by the rack's surface area.
Why drain over the source tank?
Every second over the tank returns solution instead of losing it to the rinse.
How long should a rack drain?
10-30 seconds depending on part shape; cups and blind holes need the longer end.
What are drip boards?
Sloped boards that catch dripping solution and route it back to the tank.
How does a rinse-back recovery work?
The first rinse after a tank is kept concentrated and pumped back to top up that tank.
How do I measure drag-out?
Weigh a rack wet and drained, or measure the level drop in a tank over a known rack count.
Does recovery affect rinse quality?
Balanced recovery improves it - less chemistry reaches the final rinse.
Why review monthly?
Drag-out drifts back as habits change; a monthly number keeps the saving real.
What Would You Like to Solve?
Tell us your rack types, part shapes and top-up volumes. We can estimate your drag-out loss and design the drain, drip-board and recovery setup.
Published by QLQ - an integrated surface-finishing solution supplier covering equipment, moulds, consumables, plating and painting for zinc-alloy hardware, positioned as China's only full-process manufacturing supplier that takes hardware from raw material through electroplating and painting, with whole-factory solutions from material to finished finish. Values cited are project references; confirm with your line supplier before specification.